


Sales Prediction| Importance of Sales forecasting| Using Machine Learning| End-to-End…
Last Updated on January 30, 2023 by Editorial Team
Author(s): Yashashri Shiral
Originally published on Towards AI.
Sales Prediction| Importance of Sales forecasting| Using Machine Learning| End-to-End Understanding| Part -1
Sales Forecasting determines how the company invests and grows to create a massive impact on company valuation. In this article, you will learn how to do sales prediction using Machine Learning techniques.
I’m diving this article into 4 parts,
Part 1- Understand what Sales Prediction/Forecasting and EDA
Part 2- Time Series model implementation
Part 3- Deep Learning model implementation(coming soon)
Part 4- Supervised Machine learning model implementation(coming soon)
Concept-
Forecasting, in simple words, means predicting or estimating future trends/making decisions based on past or present data. Forecasting is being utilized across different industries, from small businesses to large corporations, to understand customer demand so that companies can make the right decision about financial planning, customer success management, and supply chain control.
Sales Forecasting– is the process of predicting how much revenue a company, team, or person can generate within a certain timeframe. Accurate sales forecasts allow business leaders to make smarter decisions about setting goals, budgeting, hiring, prospecting, and determining how to fuel companies’ growth. So, in many ways, sales forecasting affects everyone in the organization. According to Mckinsey’s report, a global manufacturer’s demand forecasts were regularly off by 30% or more. As a result, teams rely on gut instincts to generate sales goals.
Importance of Sales Forecasting:
- Sales forecast allows you to spot potential issues while there’s still time to mitigate them
- Alignment of sales quota and revenue expectations
- Ability to focus a sales team on high revenue, high-profit sales pipeline opportunities, resulting in improved win rates
Why ML in sales?
As a Data Scientist, you should be able to effectively implement statistics/Machine Learning. But in real-world situations, it doesn’t stop there. Let’s say you are building an ML model to predict sales. Then one must first understand why you are doing this project, how it will impact business, and how you can improve business outcomes by building this model. If you don’t understand the business value associated with your data, it will be garbage in, garbage out of your ml model.
Now let’s understand where ML comes into the picture for sales. ML can be used in automating mundane tasks and allowing salespeople to focus their time on the most qualified opportunities. The ultimate goal is to do it more efficiently without having to invest in hiring more salespeople. In the past, most sales activities were based on the intuition of the sales rep. Machine learning is used to predict which deals will close. ML helps in predicting future trends in sales, of which one can create an interactive dashboard that would provide a single truth source to the entire organization. Sales representatives are always looking for new leads and ways to increase their sales pipeline and close more sales. Machine learning can help by providing new insights into customer behavior and patterns. ML allows businesses to create more advanced forecasting models that utilize a larger dataset with a little less human effort.
ML methods
There are two ways you can predict future sales value →
- Time Series model — You can implement the time series method, which comprises the use of some significant model to forecast future conclusions on the basis of known past outcomes. A time series data is a set of measurements taking place in a constant interval of time. Here, time acts as the independent variable, and the objective ( to study changes in characteristics) is the dependent variable.
- Supervised model — You can use a Supervised model if you extract seasonality and put it into variables. e.g., as a year, month, or day of the week, etc., along with other features which would then be used as ‘x’(dependent) variables, and ‘y’ is the actual value of the time series (in this case, sales value)
- Deep Learning and recent models — You can use deep models such as LSTM to predict the sales value. Or Prophet, which is developed by Facebook and is an extension of basic AR models. Instead of using lagged values of the target variable, the model provides an additional form of feature engineering.
Let’s now go through the basics of Time Series →
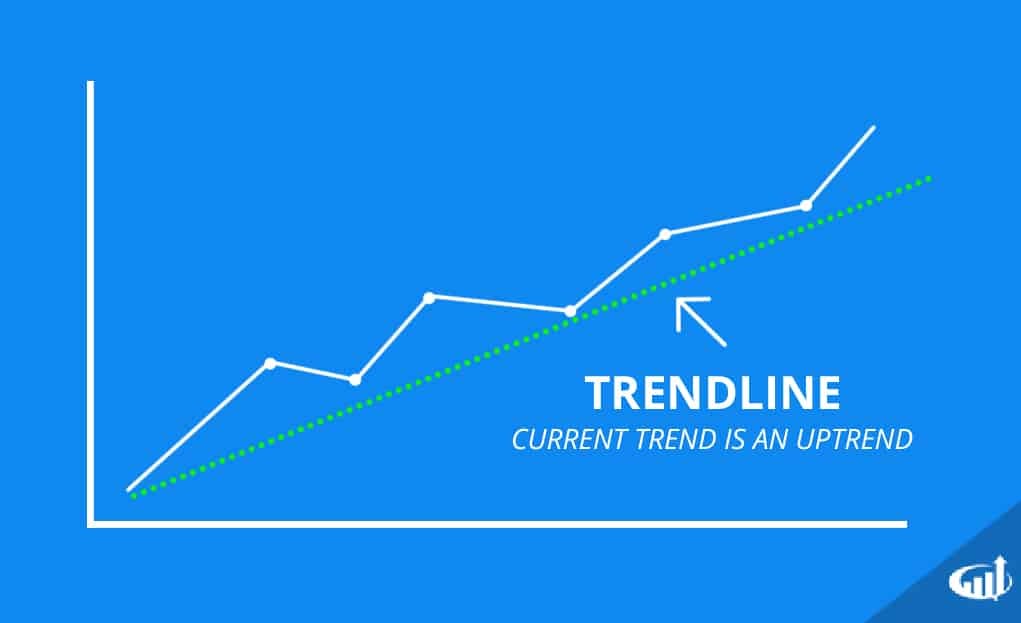
- Trend — If a time series manifests a positive long-term slope over time, it has an upward trend negative trend if it has a downtrend
- Seasonality — Seasonality refers to periodic fluctuations. Seasonality always has fixed frequencies. e.g., coat selling store sales go up in the winter season
- Stationary — A time series is said to be stationary if its properties don’t change over time i.e., it has constant mean and variance.
- Autocorrelation — Simply, autocorrelation is the similarity between observations as a function of the time lag between them.
Time series models
Time series models are used to forecast events based on historical data. Common types include ARIMA, smooth-based, and moving average. Not all models will yield the same results for the same dataset, so it’s critical to determine which one works best based on the individual time series.
Smoothing-based model — In time series forecasting, data smoothing is a statistical technique that involves removing outliers from the time series data set to make a pattern more visible. Smoothing data removes or reduces random variation and shows underlying trends and cyclic components.
Moving-average model — is a common approach for modeling univariate time series. The moving average specifies that the output variable depends linearly on the current and various past values. e.g. AR, MA, ARMA,ARIMA
Exponential smoothing model — is a thumb technique for smoothing time series data using the exponential window function. Exponential smoothing is an easily learned and easily applied procedure for making some determination based on prior assumptions by a user, such as seasonality. e.g. Holt-Winters method
Input Data —
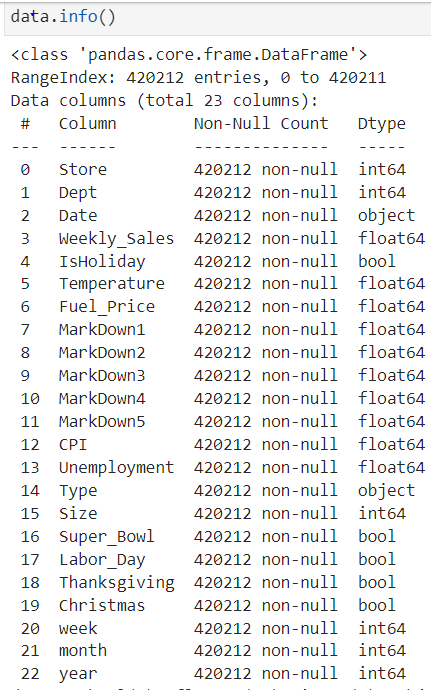
I used Walmart’s weekly sales data from Kaggle to do the analysis.
Problem Statement — We want to predict the weekly sales, and we want to understand the impact of holidays or any other factors on weekly sales.
Exploratory Data Analysis —
Now let’s start understanding data first before we implement any model, which will help us choose the right model and methodology for sales prediction.
As you can see in the table, you have weekly sales and some other features which might help us understand what’s driving more sales or vice versa.
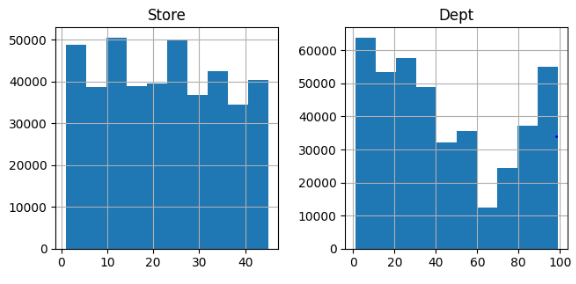
Let’s understand the distribution of these variables —
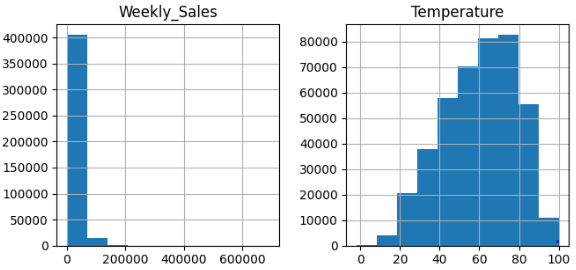
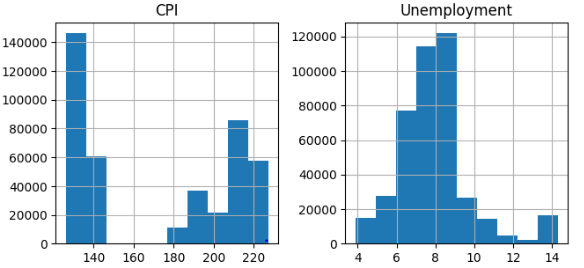
As shown in the graphs, Weekly sales are not normally distributed.
Now let’s understand if there is any correlation between numerical variables and Sales.
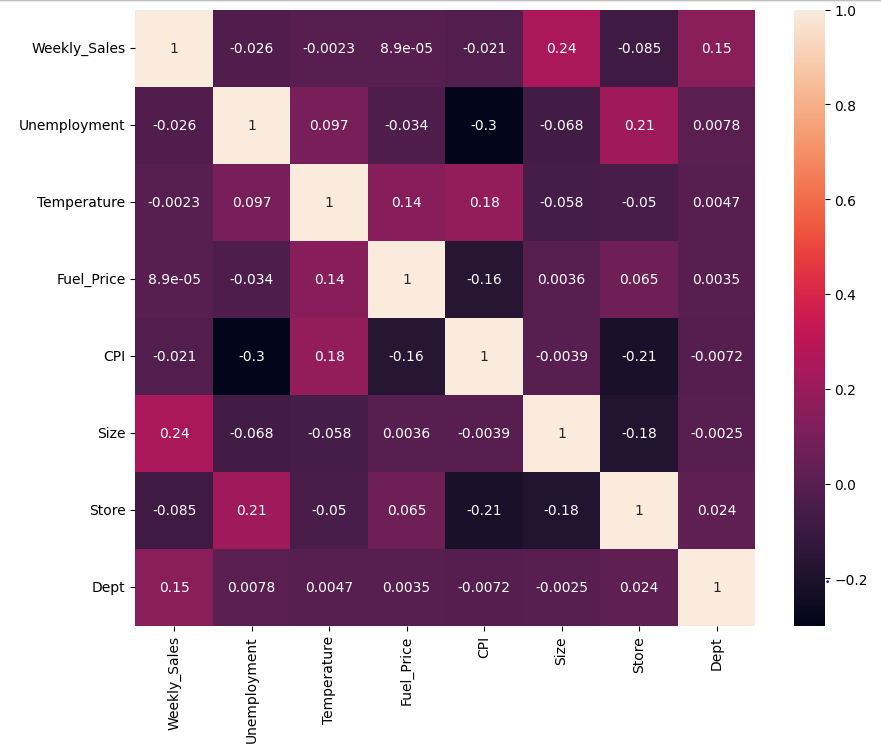
There is a low correlation between Unemployment, Temp, Fuel Price, CPI & Size with Weekly Sales. CPI/unemployment and Store/Size are negatively correlated. But Department and Size have a positive correlation with Weekly sales(not strong, though)
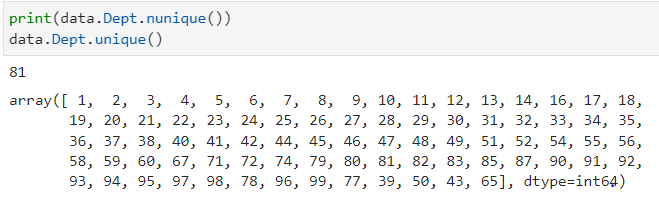
We have information about 81 departments, but there are a total of 99 departments.
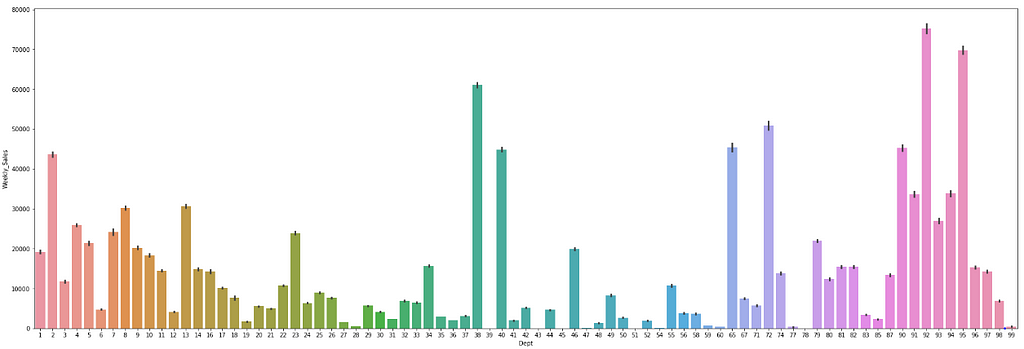
Now let’s see how these features are distributed with respect to weekly sales.
In the graph below, we can see, Weekly sales value is high for department numbers 38,40,65, 72,90,92,95.
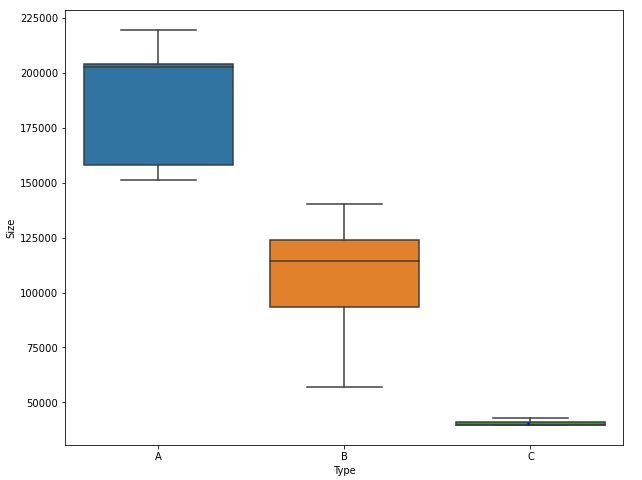
As you can see, Type A has higher weekly sales than Type B and C.
Now let’s visualize if the weekly sales go up during holidays such as the Super Bowl, Labor Day, Thanksgiving, and Christmas.
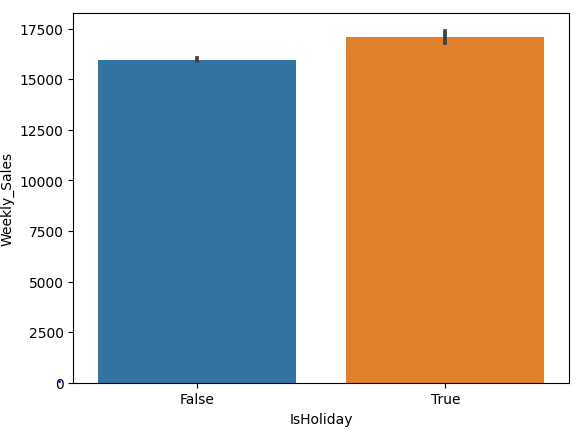
We can say that whenever there are Holidays, Weekly sales go marginally up. Now let us understand which holidays drive these sales.
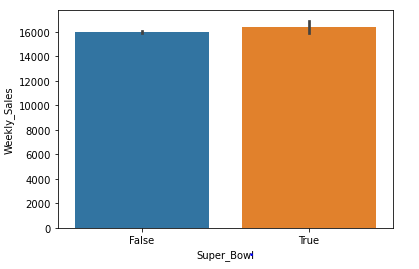
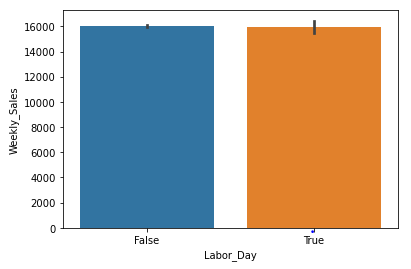
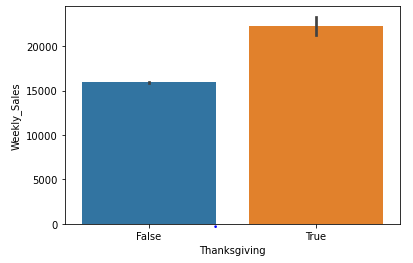
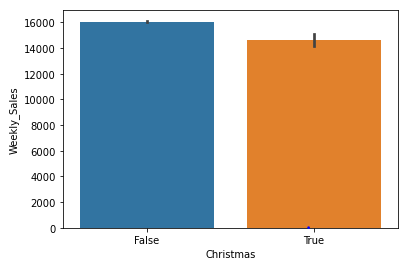
As you can see above, only during Thanksgiving are weekly sales exceeding by some amount. It’s going down during Christmas and has almost no effect during the Super Bowl and Labor day.
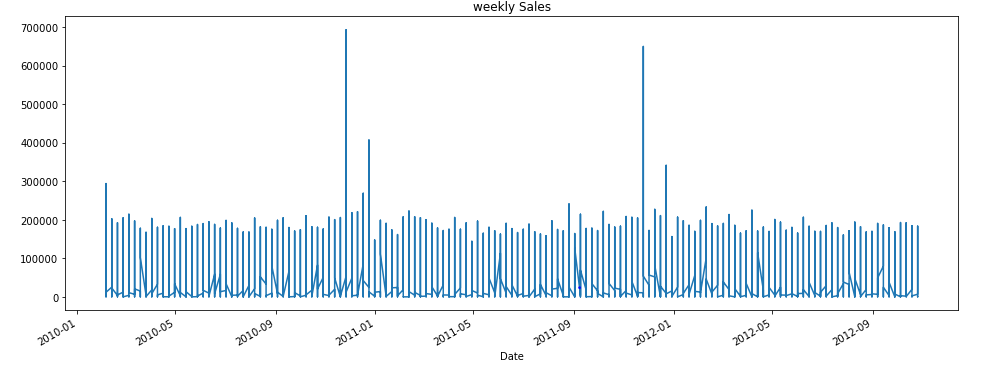
Sales over the period of time —
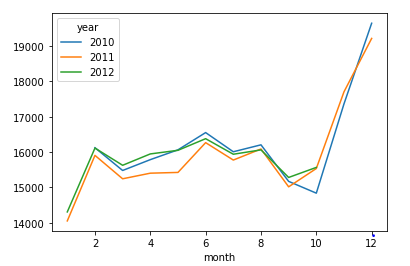
Weekly sales are going up towards the end of the year for all three years, 2010,2011,2012.
For the understanding purpose, we are going to try all the 3 modeling approaches and will compare the results. But as seen above, features like Size, Department, Store, and Holidays have a marginal effect on Sales, it seems like the time series model or LSTM deep learning model, or supervised ML model might give better results.
Let’s understand that in Parts 2,3 and 4
Please give it a clap if you find it informative and mention in the comment if I should improve anything.
Sales Prediction| Importance of Sales forecasting| Using Machine Learning| End-to-End… was originally published in Towards AI on Medium, where people are continuing the conversation by highlighting and responding to this story.
Join thousands of data leaders on the AI newsletter. Join over 80,000 subscribers and keep up to date with the latest developments in AI. From research to projects and ideas. If you are building an AI startup, an AI-related product, or a service, we invite you to consider becoming a sponsor.
Published via Towards AI
Towards AI Academy
We Build Enterprise-Grade AI. We'll Teach You to Master It Too.
15 engineers. 100,000+ students. Towards AI Academy teaches what actually survives production.
Start free — no commitment:
→ 6-Day Agentic AI Engineering Email Guide — one practical lesson per day
→ Agents Architecture Cheatsheet — 3 years of architecture decisions in 6 pages
Our courses:
→ AI Engineering Certification — 90+ lessons from project selection to deployed product. The most comprehensive practical LLM course out there.
→ Agent Engineering Course — Hands on with production agent architectures, memory, routing, and eval frameworks — built from real enterprise engagements.
→ AI for Work — Understand, evaluate, and apply AI for complex work tasks.
Note: Article content contains the views of the contributing authors and not Towards AI.
Related posts
Recent Posts
")


")


