


Regression A-Z Briefly Explained
Last Updated on January 7, 2023 by Editorial Team
Author(s): Gencay I.
Originally published on Towards AI the World’s Leading AI and Technology News and Media Company. If you are building an AI-related product or service, we invite you to consider becoming an AI sponsor. At Towards AI, we help scale AI and technology startups. Let us help you unleash your technology to the masses.
Quick and Remindful Cheatsheet for refreshing
Regression is one of the famous terms in Machine Learning.
If you want to dive into machine learning, regression and its terms definitely will be needed.
Quick reminder for you to catch up with machine learning terms;
Machine Learning A-Z Briefly Explained
Contents
· Introduction
· Terms
  ∘ Linear Regression
  ∘ Multiple Regression
  ∘ Evaluation Metrics
  ∘ Mean Squared Error
  ∘ Root Mean Squared Error
  ∘ Cost Function
  ∘ The Normal Equation
  ∘ Polynomial Regression
  ∘ Quadratic Function
  ∘ bodycal
· Conclusion
Introduction
This article has been saved too many times by the medium users, so I have decided to split model types from A-Z.
Now it is time for regression, sure if your interest in that kind of article will continue, I will write Classification A-Z and Clustering A-Z too.
That kind of brief explanation article may help you to find out your weak spot about that topic.
Or just a reminder before your personal or work project or even interesting, for your job interview.
Now let's skip the chit-chat and dive into linear regression terms.
Terms
Linear Regression
It is just a linear function.
Suppose you want to predict the price of a car and it only depends on the engine size.
Then, the price of a car would be y and the engine size would be x.
θ would define the function and predicts how much the price change according to the engine size.
Suppose θ = 2, if you change the engine size 1, the price change 2, just as simple as that.
Formula
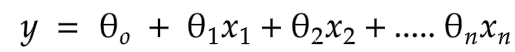
Variables
y = predicted value
n = number of features
In simple linear regression, n = 1, if n > 1 it will be multiple linear regression.
θ = model parameter
Graph
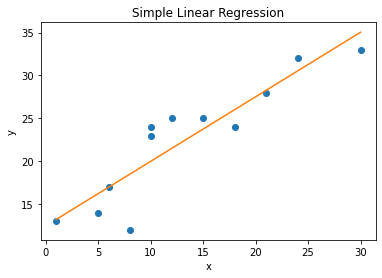
Let's suppose our function is ;
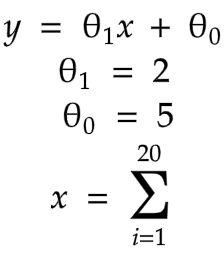
Then our graph will be ;
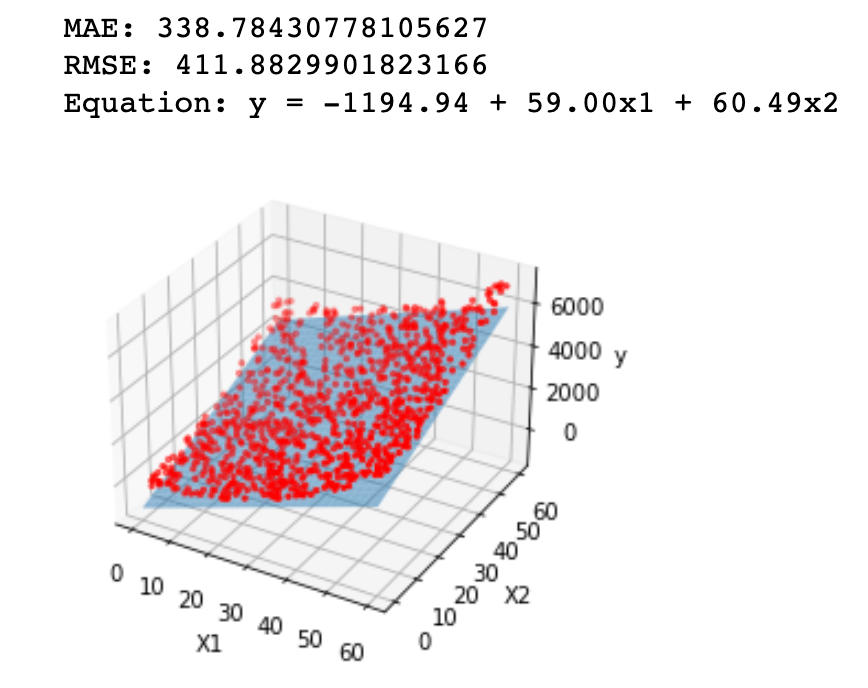
Multiple Regression
This time the price of car y depends on engine size X1 and the mileage X2.
Function
The same function with linear regression, however, this time n > 1.
Variables
y = predicted value
n = number of features
θ = model parameter
x = features
Graphic
Evaluation Metrics
RMSE, and MSE which will be explained now, both are evaluation metrics that give us the chance of rating the model's performance.
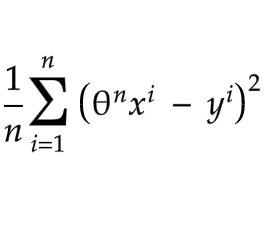
Mean Squared Error
It is an evaluation metric & performance measure of our model.
Suppose you predict y to be 5000, and it is actually 4000 and you got 10 of y value.
Now, 5000–4000 is equal to 1000. You have to find 10 values like that, you will sum these values, take a square and sum the number of the values.
It looks a little bit confusing at first, but try to understand it from the function or look it up in real-life examples.
Function
Variables
y = predicted value
n = number of features
θ = model parameter
x = features
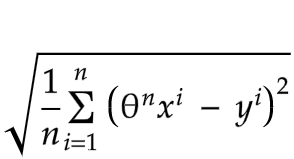
Root Mean Squared Error
Same as stated above, just mathematically root the function.
Function
Variables
y = predicted value
n = number of features
θ = model parameter
x = features
Cost Function
The cost function is one of the functions that you chose and with that, you will evaluate your model's performance, like root mean square or mean squared error.
The Normal Equation
Now, this equation is used for finding the best model parameter(θ) that minimizes your cost function in linear models.
It looks like mathematically a bit complex but if you are familiar with NumPy it is easy to code.
If you are not familiar with NumPy or programming language, do not worry there are plenty of courses existed on the internet, and most of them are free.
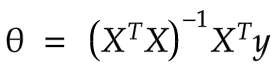
Variables
y = predicted
θ = is the value, which minimizes the cost function
x = features
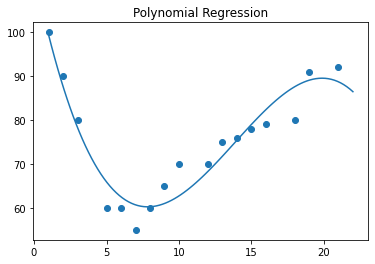
Polynomial Regression
If your data is more complex to show with a straight line, you can add powers to your features to explain the curve.
Function

Graph
Variables
y = predicted value
n = number of features
θ = model parameter
x = features
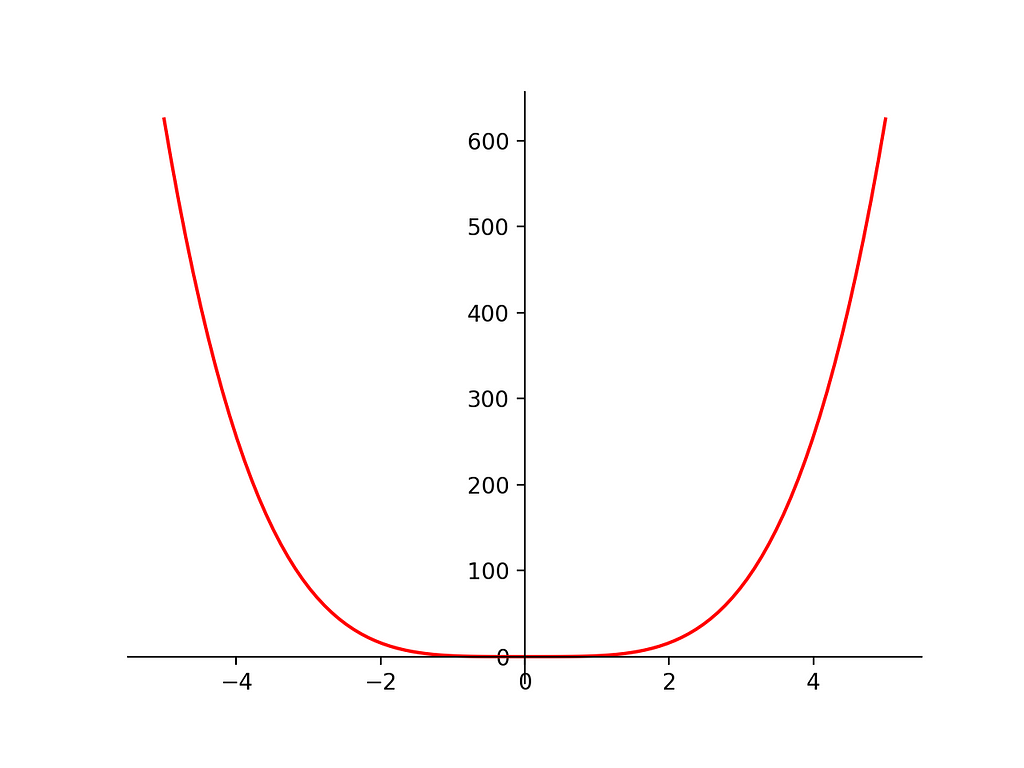
Quadratic Function
That is a simply functions with powers(x**2)
Function
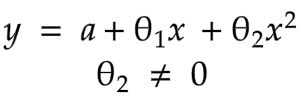
Variables
y = predicted value
a = intercept
θ = model parameter
x = features
Graph
If some of the statistical terms are a bit confusing or unfamiliar to you, actually, I have an article, another A-Z, which is about statistics, you may want to check that too.
Statistics for Machine Learning A-Z
Expressing your knowledge in different ways, with graphs — formulas, and descriptions may help you to refresh.
I try to do it in a very simple way for the people who will read this article.
On the other hand, there are too many terms as follows which I can explain to you in Chapter 2 of this article, such;
- Regularized Linear Models
- Ridge Regression
- Lasso Regression
- Elastic Net
- Logistic Regression
- Softmax Regression
- Confidence Interval
And also here there is another article of mine.
In the following article, I tried to predict my weight according to my body measurements by using a Regression Model.
bodycal
Here also I wrote a Python library, name bodycal.
Installation
pip install bodycal
You could find your
- BMI -Body Mass Index
- BMR- Basal Metabolic Rate
- body fat percentage
by using that library.
Sounds interesting right, let's check my linear model and my library.
Regression Model in Weight Prediction
Conclusion
Yes, that's it.
Regression, is probably one of the most used models, like classification.
Classification A-Z Briefly Explained article is on the way.
I will add the link after it will be finished.
Thanks for all your support, claps and follows.
That really motivates me to create good educational content.
I love sharing my knowledge and also that's how, after many times pass, I could refresh my memory too.
“Machine learning is the last invention that humanity will ever need to make.” Nick Bostrom
Regression A-Z Briefly Explained was originally published in Towards AI on Medium, where people are continuing the conversation by highlighting and responding to this story.
Join thousands of data leaders on the AI newsletter. It’s free, we don’t spam, and we never share your email address. Keep up to date with the latest work in AI. From research to projects and ideas. If you are building an AI startup, an AI-related product, or a service, we invite you to consider becoming a sponsor.
Published via Towards AI
Towards AI Academy
We Build Enterprise-Grade AI. We'll Teach You to Master It Too.
15 engineers. 100,000+ students. Towards AI Academy teaches what actually survives production.
Start free — no commitment:
→ 6-Day Agentic AI Engineering Email Guide — one practical lesson per day
→ Agents Architecture Cheatsheet — 3 years of architecture decisions in 6 pages
Our courses:
→ AI Engineering Certification — 90+ lessons from project selection to deployed product. The most comprehensive practical LLM course out there.
→ Agent Engineering Course — Hands on with production agent architectures, memory, routing, and eval frameworks — built from real enterprise engagements.
→ AI for Work — Understand, evaluate, and apply AI for complex work tasks.
Note: Article content contains the views of the contributing authors and not Towards AI.
Related posts
Recent Posts


")

