


Gentle Introduction to Statistics for Machine Learning
Last Updated on May 14, 2022 by Editorial Team
Author(s): Hope Ogidan
Originally published on Towards AI the World’s Leading AI and Technology News and Media Company. If you are building an AI-related product or service, we invite you to consider becoming an AI sponsor. At Towards AI, we help scale AI and technology startups. Let us help you unleash your technology to the masses.
WHAT IS STATISTICS?
Statistics can also be defined as the science of collecting, analyzing, and interpreting data. Statistics is a field that has been existing for a long time now and it’s also a must-know field for every data scientist. It involves the study of data to obtain actionable insights that will be used for decision-making. That is the definition of statistics in its simplest form.
In statistics, there are some terminologies that you have to be conversant with, I will be defining a few of them here:
1. CONSTRUCT: A construct is any occurrence or event that is difficult to measure. For example, the feeling of happiness, the feeling of sadness, and how well you slept. All these events do not have a defined way of measurement.
2. OPERATIONAL DEFINITION: An operational definition is usually introduced so that it’s easy to define a construct.
3. POPULATION: This is the total number of people and things understudy
4. SAMPLE: A sample is the part of the population under study
5. VARIABLES: These are factors that could cause a particular occurrence.
6. HYPOTHESIS: This is a statement describing the relationship between variables
Now that you have known some basic terminologies in the field of statistics…
let’s take a recap of the definition of machine learning.
Machine learning is the ability of computers to learn patterns from data and make predictions. It used data science techniques to analyze the data and the field of statistics is one of the subsets of data science. A lot of techniques used in machine learning are made possible through the field of statistics.
Therefore, the knowledge of statistics is very important for you as a data scientist to know what is going on under the hood. You can be able to build models as a machine learning engineer without the knowledge of statistics but a good understanding of how the process works under the hood is very important for your progress and also the explainability of your codes as companies won’t employ anyone who can’t offer proper explanations of their codes. They will prefer to employ someone who has a proper understanding of what he\she is doing.
Branches of Statistics
Statistics is mainly divided into:
1. Descriptive Statistics
2. Inferential statistics
Descriptive Statistics

In descriptive statistics, you are mainly organizing and summarizing your data using numbers and graphs. For example, you could summarize your data into a bar graph, pie chart, histogram, etc.
To describe your data using graphs, you can make use of the following:
- Bar graph
- Line graph
- Histogram
- Pie chart
To describe your data using numbers, you mainly make use of the following:
1. Measure of center
2. Measure of dispersion
Measure of center
A measure of central tendency is a single value that attempts to group values by identifying the central position within a group of data.
There are three measures of center, they are:
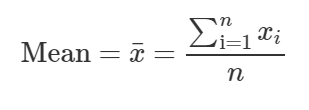
I. Mean
The mean of a particular data is the sum of the samples divided by the total number of samples. It is usually affected by outliers.
The formula for mean:
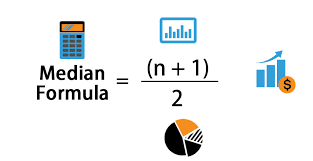
II. Median
The median is the middle of the data. One of the properties of the median is that it is not usually affected by outliers unlike the mean
The formula for median:
III. Mode
The mode shows us the most occurring sample in the distribution.
Measure of dispersion

The measure of dispersion helps you to determine how far the data points are from themselves.
We have three measures of dispersion namely:
Range, variance, standard deviation
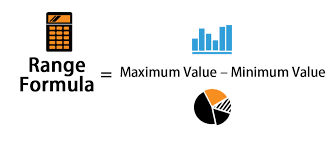
i. Range
This is the difference between the maximum and minimum values in the distribution
The formula for the range is:
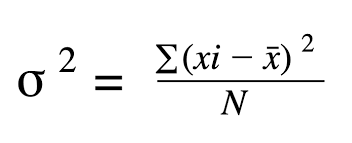
ii. Variance
This is the sum of all the squared deviation of the sample means from the population means.
The formula for variance:
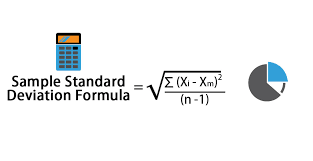
iii. Standard deviation
This is the squared root of the variance
The formula for standard deviation is:
Empirical rule
In statistics, we do follow the empirical rule which states that
68% of your data falls within one standard deviation from the mean of the distribution
95% of the data falls within the two standard deviation from the mean of the distribution
99.7% of the data falls within the three standard deviations from the mean of the distribution.
The empirical rule has a lot of applications in probability but will not be diving into those applications as those concepts are beyond the scope of this article.
Central limit theorem
The central limit theorem states that
As the number of trials increases, the value of observes probability approaches the theoretical probability.
Z score
Z score is used in statistics to find how far in terms of the standard deviation a number is from the mean
Inferential statistics

This branch of statistics samples data to conclude the population. In inferential statistics, you will learn about estimation and how you can get information about a population from its sample.
In real-world problems, it can be a little difficult for us to get the total population, so we make use of samples in most cases.
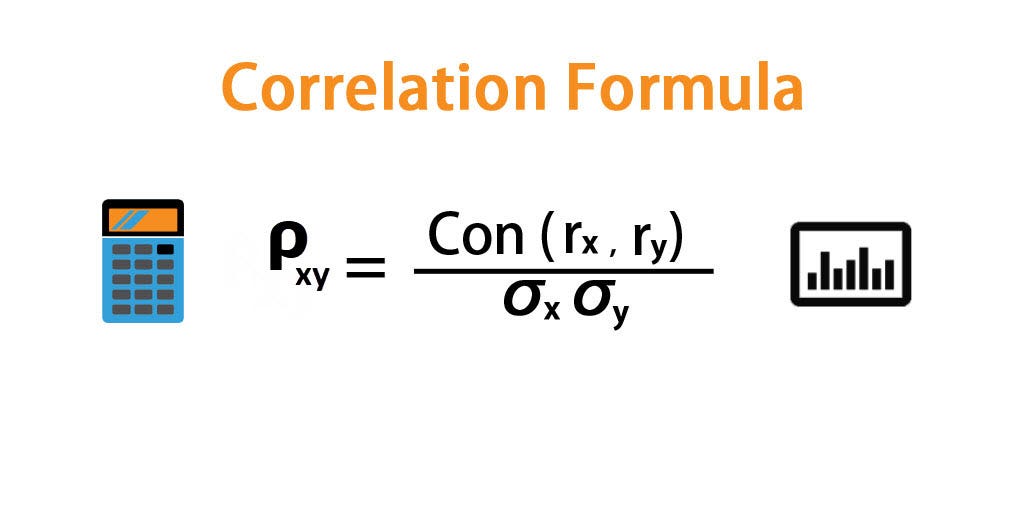
Correlation
Correlation helps us to define the relationships between variables in our dataset.
As a data scientist, it is very important for you to know how well your independent variables correlate with each other so that you know what variables to combine together during feature engineering and you must also know how the independent variables correlate with the dependent variable.
Just as we have units of measurement in maths for measuring length, mass, time, etc we also have a measure of correlation in statistics called correlation coefficient (r)
It is used to quantify the strength of the relationships between variables
There is an important point that you to note
Non Correlation doesn’t imply independence. Correlation doesn’t equal causation.
Correlation coefficients;
Close to 1= large positive correlation
Close to -1 = large negative correlation
Close to 0= no relationship”
Conclusion
I hope you have been able to get a good idea of what statistics is and its importance to you as a Data Scientist/Machine learning engineer.
Thanks to all who inspired me to do this. Connect with me on LinkedIn and Twitter and see how well we can bond.
Gentle Introduction to Statistics for Machine Learning was originally published in Towards AI on Medium, where people are continuing the conversation by highlighting and responding to this story.
Join thousands of data leaders on the AI newsletter. It’s free, we don’t spam, and we never share your email address. Keep up to date with the latest work in AI. From research to projects and ideas. If you are building an AI startup, an AI-related product, or a service, we invite you to consider becoming a sponsor.
Published via Towards AI
Towards AI Academy
We Build Enterprise-Grade AI. We'll Teach You to Master It Too.
15 engineers. 100,000+ students. Towards AI Academy teaches what actually survives production.
Start free — no commitment:
→ 6-Day Agentic AI Engineering Email Guide — one practical lesson per day
→ Agents Architecture Cheatsheet — 3 years of architecture decisions in 6 pages
Our courses:
→ AI Engineering Certification — 90+ lessons from project selection to deployed product. The most comprehensive practical LLM course out there.
→ Agent Engineering Course — Hands on with production agent architectures, memory, routing, and eval frameworks — built from real enterprise engagements.
→ AI for Work — Understand, evaluate, and apply AI for complex work tasks.
Note: Article content contains the views of the contributing authors and not Towards AI.
Related posts
Recent Posts


")

