


The Evolution of Tabular Data: From Analysis to AI
Last Updated on August 16, 2023 by Editorial Team
Author(s): Abid Ali Awan
Originally published on Towards AI.
Discover how tabular data space is being transformed by Kaggle competitions, the open-source community, and Generative AI.
Introduction
Tabular data refers to data organized into rows and columns. It encompasses everything from CSV files and spreadsheets to relational databases. Tabular data has been around for decades and is one of the most common data types used in data analysis and machine learning.
Traditionally, tabular data has been used for simply organizing and reporting information. However, over the past decade, its usage has evolved significantly due to several key factors:
- Kaggle Competitions: Kaggle emerged in 2010 [1] and popularized data science and machine learning competitions using real-world tabular datasets. This exposed many data scientists and machine learning engineers to the power of analyzing and building models on tabular data.
- Open-source Contributions: Thanks to major open-source libraries like Pandas, DuckDB, SDV, and Scikit-learn, manipulating, preprocessing, and building predictive models on tabular data is now incredibly easy. Additionally, open-source datasets provide beginners with easy access to practice on real-world datasets.
- Generative AI: Recent advances in generative AI, especially large language models, now enable the generation of realistic tabular data and make it easy for basically anyone to conduct Data analysis and build machine learning applications.
In the essay, we will discuss each of these factors in more detail and look at examples of how companies and researchers are using tabular data in innovative ways today. The main takeaway will be the importance of analyzing and preparing tabular data in the right way to reap the benefits of machine learning and AI.
This essay is a part of the 2023 Kaggle AI Report, a competition where participants write an essay on one of seven topics. The prompt asks them to describe what the community has learned over the past two years of working and experimenting.
Tabular Data Kaggle Competitions
The Kaggle Competition has profoundly impacted the field of data science and machine learning engineering. Additionally, Tabular competitions have introduced new techniques, tools, and various tabular tasks.
In addition to learning and knowledge development, winning competitions often come with cash prizes, providing further motivation for participation. For example:
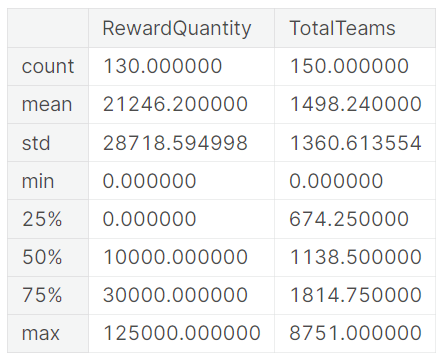
- On average, Kaggle competitions offer prize money of around $21,246 and have approximately 1,498 participating teams.
- The largest cash prizes have been as high as $125,000, giving the winners a significant incentive to go the extra mile and push the boundaries of what’s possible with tabular data.
Note: We will be using Meta Kaggle dataset for our analysis and code examples. The dataset is under Apache 2.0, and it is updated daily.
import pandas as pd

comptags = pd.read_csv("/kaggle/input/meta-kaggle/CompetitionTags.csv")
tags = pd.read_csv("/kaggle/input/meta-kaggle/Tags.csv")
comps = pd.read_csv("/kaggle/input/meta-kaggle/Competitions.csv")


tabular_competition_ids = comptags.query("TagId == 14101")['CompetitionId']
tabular_competitions = comps.set_index('Id').loc[tabular_competition_ids]
tabular_competitions.describe()[["RewardQuantity","TotalTeams"]]
Over the last decade, Kaggle has hosted numerous competitions centered around tabular data, with several since 2015 offering cash prizes of up to $100,000 for the winning team.
import plotly.express as px

tabular_competitions["EnabledDate"] = pd.to_datetime(
 tabular_competitions["EnabledDate"], format="%m/%d/%Y %H:%M:%S"
)
tabular_competitions["EnabledDate"] = tabular_competitions["EnabledDate"].dt.year
tabular_competitions.sort_values(by="EnabledDate", inplace=True)

fig = px.bar(
 tabular_competitions,
 x="EnabledDate",
 y="RewardQuantity",
 title="Reward Distribution of Tabular Competitions over the Years",
 labels={"RewardQuantity": "Prize Money($)", "EnabledDate": "Year"},
)

fig.show()

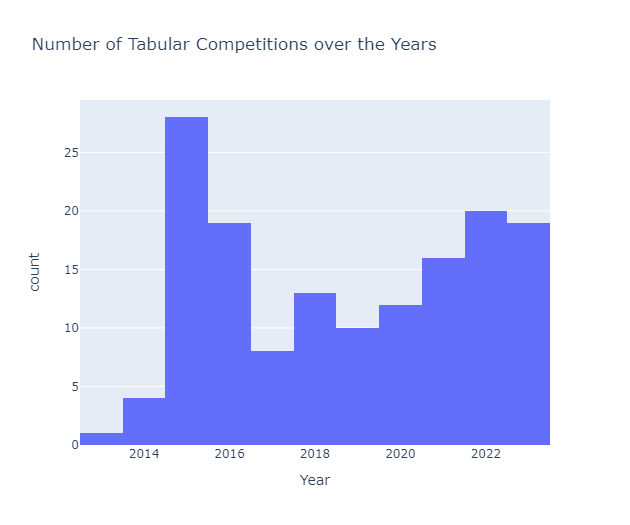
The number of tabular data competitions has grown significantly over this period, with particularly high activity in 2015 and 2022.
fig = px.histogram(
 tabular_competitions,
 x="EnabledDate",
 nbins=20,
 title="Number of Tabular Competitions over the Years",
 labels={"EnabledDate": "Year"},
)
fig.show()
Tabular Playground Series
Due to the large demand for tabular data problems, the Kaggle staff started an experiment in 2021 [2] by launching a monthly contest called the Tabular Playground Series. These competitions aimed to provide a consistent platform for competitors to hone their skills on tabular data.
The Tabular Playground Series contests were based on synthetic datasets that replicated the structure of public data or data from previous Kaggle competitions. The synthetic datasets were created using a deep-learning generative network called CTGAN.[3]
- Exposure: Many machine learning practitioners got their first exposure to working with tabular data through Tabular Playground Series. This helped familiarize them with concepts like data loading, feature engineering, and model tuning.
- Techniques: Kaggle competitions showcased techniques like feature engineering, data augmentation, and ensemble modeling that are particularly useful for tabular data. Competitors used these techniques to achieve higher scores, setting examples for others.
- Community: The discussions within Kaggle competitions provided a fertile ground for sharing techniques and ideas on how to best handle tabular data. This helped form a community of practice around tabular data.
- Democratization: Kaggle competitions have made machine learning on tabular data more accessible to a wider audience, not just data experts. Participants get free access to both CPU and GPU, as well as to large datasets, and anyone is welcome to participate in the competition.
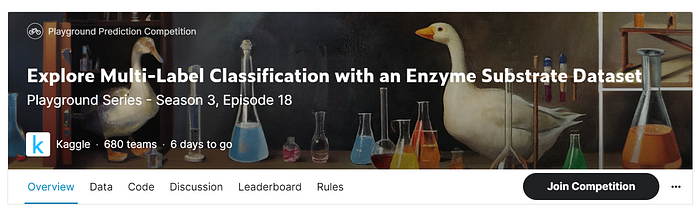
The Tabular Playground Series is still ongoing, currently in Season 3 with Episode 18. This demonstrates that cash prizes are not the only motivation for participants, as these competitions do not offer any monetary prizes or points systems. Rather, the series caters to data enthusiasts who want to hone their skills by practicing various types of tabular data.
Competition Solutions
Examination of winning solutions has revealed that fancy tools or deep learning models are not necessary to place highly. Even simpler models like linear regression, with careful feature engineering, can win prizes. The key is finding simple yet effective techniques for solving the given problem.
For example, the winner [4] of the GoDaddy — Microbusiness Density Forecasting competition [5] used Linear Regression. This is unsurprising as winning solutions are often based on simple models but involve extensive feature selection, cross-validation, data augmentation, and ensemble techniques.
Tabular Data Open-source Contributions
Open-source contributions related to tabular data have been invaluable for advancing the field and enabling real-world applications. Contributions fall into two main categories:
- Open-source Datasets
- Open-source Tools
Open-source Datasets
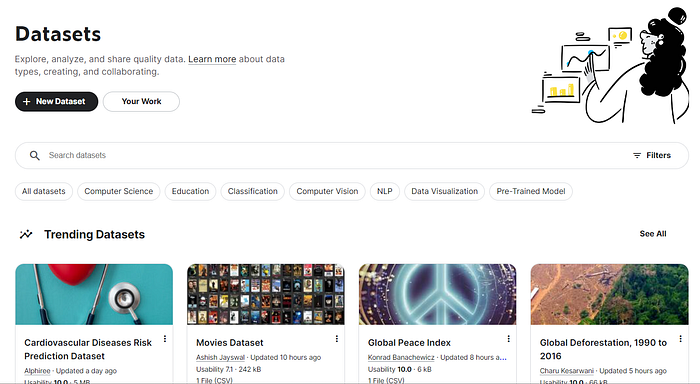
Kaggle owes its success to the generous contributions of open-source contributors who share real-world tabular datasets for machine learning problems. These datasets, covering various domains and use cases, provide valuable training and benchmarking data for the machine learning community. Numerous companies and organizations have openly contributed their proprietary tabular data to advance the field. The remarkable number and diversity of datasets available on Kaggle have been an essential driver for innovation in working with tabular data.
Kaggle dataset [6] is the go-to place for beginners and experts alike who are looking for specific datasets. Its vast collection of tabular datasets is helping hundreds of community members daily to practice new techniques and handle new types of data.
Open-Source Tools
Several major open-source tools for analyzing, manipulating and modeling tabular data have been made possible by the contributions of developer communities. Tools like Pandas, Numpy, scikit-learn, TensorFlow, XGBoost, and many others have been crucial enablers for working with tabular data at scale. These libraries provide a comprehensive set of functionalities that have made tabular data machine learning accessible to a wide audience. Ongoing community contributions ensure the tools continue to improve and keep pace with new requirements.
Additionally, there are now efficient tools available such as DuckDB and PySpark, that offer a user-friendly yet powerful way to analyze and process large tabular datasets.
%pip install duckdb -q
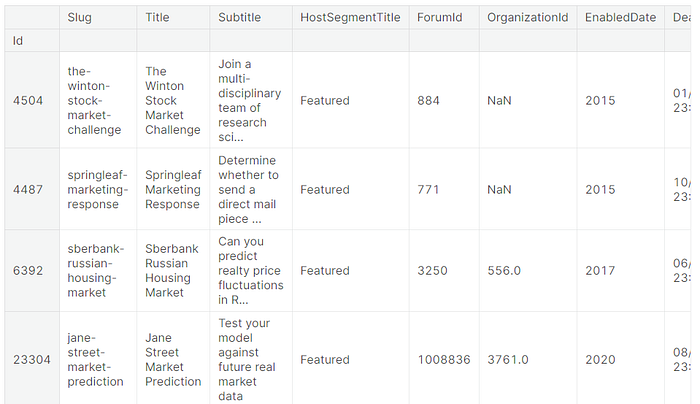
With DuckDB, you can easily import a CSV file and run SQL queries in just seconds.
import duckdb

duckdb.sql('SELECT * FROM "/kaggle/input/meta-kaggle/Competitions.csv" LIMIT 5')
┌───────┬────────────────┬──────────────────────┬───┬──────────────────────┬──────────┬───────────────────┐
│ Id │ Slug │ Title │ … │ EnableSubmissionMo… │ HostName │ CompetitionTypeId │
│ int64 │ varchar │ varchar │ │ boolean │ varchar │ int64 │
├───────┼────────────────┼──────────────────────┼───┼──────────────────────┼──────────┼───────────────────┤
│ 2408 │ Eurovision2010 │ Forecast Eurovisio… │ … │ false │ NULL │ 1 │
│ 2435 │ hivprogression │ Predict HIV Progre… │ … │ false │ NULL │ 1 │
│ 2438 │ worldcup2010 │ World Cup 2010 - T… │ … │ false │ NULL │ 1 │
│ 2439 │ informs2010 │ INFORMS Data Minin… │ … │ false │ NULL │ 1 │
│ 2442 │ worldcupconf │ World Cup 2010 - C… │ … │ false │ NULL │ 1 │
├───────┴────────────────┴──────────────────────┴───┴──────────────────────┴──────────┴───────────────────┤
│ 5 rows 42 columns (6 shown) │
└─────────────────────────────────────────────────────────────────────────────────────────────────────────┘
Perform quick and multiple actions on tabular data using Python Relational API. Its syntax is similar to pandas, making it easy to use.
rel = duckdb.read_csv('/kaggle/input/meta-kaggle/Competitions.csv')
rel.filter("RewardQuantity > 100000").project(
 "EnabledDate,RewardQuantity"
).order("RewardQuantity").limit(5)
┌─────────────────────┬────────────────┐
│ EnabledDate │ RewardQuantity │
│ varchar │ double │
├─────────────────────┼────────────────┤
│ 07/25/2019 21:10:14 │ 120000.0 │
│ 11/02/2021 16:00:27 │ 125000.0 │
│ 11/14/2016 08:02:32 │ 150000.0 │
│ 11/22/2021 18:53:57 │ 150000.0 │
│ 05/11/2022 18:46:43 │ 150000.0 │
└─────────────────────┴────────────────┘
Generative AI for Tabular Data
Generative AI is a subfield of artificial intelligence powered by neural networks like Variational Autoencoders and Generative Adversarial Networks (GANs) that can generate photorealistic images, compose original pieces of music, write news articles and stories, and even design objects. It is trained on large datasets, allowing Generative AI models to discover the underlying patterns, structures, and statistical distributions present in the data.
Generative AI models have significantly progressed the field of working with tabular data. Capabilities like data augmentation, anomaly detection and synthetic data generation have helped tackle issues like data scarcity, privacy and bias.
However, recent advances like ChatGPT and other large language models (LLMs) are now also being used as assistants for tabular data tasks. Some of the ways generative AI is transforming our workflows include:
- Code assistance: LLMs like ChatGPT can help with coding tasks like feature engineering, preprocessing, modeling and evaluating machine learning pipelines for tabular data. They can suggest code snippets, functions and entire scripts.
- Data understanding: Generative AI can provide insights into the data distributions, correlations, missing values, outliers, target variables and more.
- Deep analysis: It performs statistical tests, creates visualizations and derives other summary metrics that give practitioners a thorough analysis of tabular datasets to inform modeling decisions.
- Web scraping: Generative AI tools can help you scrape new tabular data from websites/application, assisting with data acquisition tasks.
While issues like safety, bias, and narrow capability remain, large language models are beginning to transform how data scientists and machine learning engineers work with tabular data on a day-to-day basis. They are increasingly becoming assistants that handle various analytical and coding tasks, freeing up practitioners to focus on higher-level work.
ChatGPT for Tabular Data
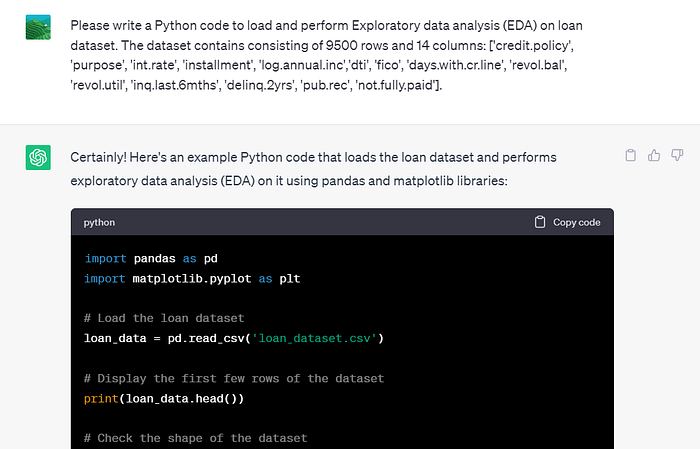
ChatGPT [7] has rapidly become an invaluable assistant for nearly every stage of working with tabular data, from helping with data cleaning and feature engineering to generating complex model code, interpreting metrics, producing data analysis reports, and even aiding in synthetic data generation for tasks like data augmentation and anomaly detection.
With ChatGPT, you can easily build and train a machine-learning model by simply typing a detailed prompt. Additionally, you can utilize multiple plugins to automate complex tasks such as running the code and getting internet access.
Check out “A Guide to Using ChatGPT For Data Science Projects”[8] to learn how to use ChatGPT in a real-life end-to-end data science project.
Generative AI Tools for Tabular Data
Generative AI tools, such as PandasAI [9], have made data analysis, dataset cleaning, and data visualization extremely easy for anyone. These tools use large language models like gpt-3.5-turbo [10] to generate insightful results. Additionally, you can also connect with open-source models hosted on Hugging Face to perform AI analysis.
%pip install pandasai -q
from kaggle_secrets import UserSecretsClient
from pandasai import PandasAI
from pandasai.llm.openai import OpenAI

user_secrets = UserSecretsClient()
secret_value_0 = user_secrets.get_secret("OPENAI_API_KEY")

llm = OpenAI(api_token=secret_value_0)

pandas_ai = PandasAI(llm)
To see the top five competitions with the highest RewardQuantity, we asked ChatGPT to display them by typing a prompt.
pandas_ai.run(tabular_competitions, prompt='Can you provide a list of the top five competitions with the highest RewardQuantity? Please only show the name of the competition,Date,and the corresponding reward.')

You can even ask it to perform complex tasks or generate visualizations.
pandas_ai.run(tabular_competitions, prompt='Please list all the competition which has "Market" in it.')
This is just the beginning, as we will see many new AI tools that make data scientists' and developers lives easier by automating tasks and providing assistance.
Conclusion
While significant progress has been made in leveraging tabular data for machine learning and AI applications, we have likely only seen the beginning. In the future, we can expect new powerful tools driven by advanced AI agents [11] that will automate the entire workflow for tabular machine learning tasks — from data ingestion and cleaning to feature engineering, model training, evaluation, and deployment in web applications. With continued advances in generative AI and natural language processing, these agents will be able to take high-level prompts to complete entire tabular data science projects, from data to insights.
This essay highlights the significant impact of Kaggle competitions, open-source communities, and generative AI on our approach to working with tabular data for tasks such as data analysis and machine learning. To delve deeper into the topic, you can read the winning essays from the 2023 Kaggle AI Report competition.[12]
Reference
[1] Wikipedia contributors, “Kaggle,” Wikipedia, Jun. 2023, [Online]. Available: https://en.wikipedia.org/wiki/Kaggle
[2] “Tabular Playground Series — Jan 2021 U+007C Kaggle.” https://www.kaggle.com/competitions/tabular-playground-series-jan-2021
[3] Sdv-Dev, “GitHub — sdv-dev/CTGAN: Conditional GAN for generating synthetic tabular data.,” GitHub. https://github.com/sdv-dev/CTGAN
[4] KAGGLEQRDL, “#1 solution — generalization with linear regression,” Mar. 16, 2023. https://www.kaggle.com/competitions/godaddy-microbusiness-density-forecasting/discussion/395131
[5] “GoDaddy — Microbusiness Density Forecasting U+007C Kaggle,” Dec. 15, 2022. https://www.kaggle.com/competitions/godaddy-microbusiness-density-forecasting/overview
[6] “Find Open Datasets and Machine Learning Projects U+007C Kaggle.” https://www.kaggle.com/datasets
[7] “Introducing ChatGPT,” OpenAI, Nov. 30, 2022. https://openai.com/blog/chatgpt
[8] A. A. Awan, “A Guide to Using ChatGPT For Data Science Projects,” Mar. 2023, [Online]. Available: https://www.datacamp.com/tutorial/chatgpt-data-science-projects
[9] Gventuri, “GitHub — gventuri/pandas-ai: Pandas AI is a Python library that integrates generative artificial intelligence capabilities into Pandas, making dataframes conversational,” GitHub. https://github.com/gventuri/pandas-ai
[10] “GPT-3.5,” OpenAI. https://platform.openai.com/docs/models/gpt-3-5
[11] R. Cotton, “Introduction to AI Agents: Getting Started With Auto-GPT, AgentGPT, and BabyAGI,” May 2023, [Online]. Available: https://www.datacamp.com/tutorial/introduction-to-ai-agents-autogpt-agentgpt-babyagi
[12] “2023 Kaggle AI Report.” May 2023, [Online]. Available: https://www.kaggle.com/competitions/2023-kaggle-ai-report/leaderboard
Join thousands of data leaders on the AI newsletter. Join over 80,000 subscribers and keep up to date with the latest developments in AI. From research to projects and ideas. If you are building an AI startup, an AI-related product, or a service, we invite you to consider becoming a sponsor.
Published via Towards AI
Related posts


Popular posts

 for 2021")


Updates

Recent Posts


