How To Understand Others Python Code Easily?
Last Updated on August 15, 2023 by Editorial Team
Author(s): Akula Hemanth Kumar
Originally published on Towards AI.
Invaluable for Strengthening Your Interview DSA Preparation
Navigating through someone else’s Python code can often feel like exploring a foreign land. Whether you’re collaborating on a project, contributing to open-source software, or inheriting code, the ability to comprehend and make sense of unfamiliar codebases is a crucial skill for any developer. While the challenges might seem daunting, there are strategies and techniques that can significantly simplify the process of understanding others’ Python code. In this guide, we will delve into proven methods that empower you to unravel the intricacies of foreign code with confidence and efficiency. By the end, you’ll be equipped with valuable insights to seamlessly step into the world of others’ Python code and make it your own.
The Challenge of Understanding Others’ Code
- Different Styles and Conventions: Every developer has their coding style, and when you’re tasked with understanding code written by someone else, their approach might differ significantly from yours. Variable names, formatting, and overall structure can be unfamiliar, making it harder to follow the logic.
- Lack of Comments and Documentation: Clear comments and documentation play a crucial role in explaining the purpose and functionality of code. However, not all code comes with comprehensive documentation, leaving you to decipher the logic solely from the code itself.
- Complex Algorithms and Logic: Sometimes, you encounter complex algorithms or intricate logic that is difficult to grasp without a deep understanding of the problem domain. This complexity can lead to confusion and frustration when trying to understand how the code works.
- Missing Context: Code often exists within a larger system or project. Without understanding the broader context in which the code operates, it can be challenging to make sense of its purpose and functionality.
Let's try to understand below Code of finding the Longest Palindrome Substring from the given string
class Solution:
 def longestPalindrome(self, s: str) -> str:
 res = ""
 for i in range(len(s)):
 # odd case, like "aba"
 tmp = self.helper(s, i, i)
 if len(tmp) > len(res):
 res = tmp
 # even case, like "abba"
 tmp = self.helper(s, i, i + 1)
 if len(tmp) > len(res):
 res = tmp
 return res

 # get the longest palindrome, l, r are the middle indexes
 # from inner to outer
 def helper(self, s, l, r):
 while l >= 0 and r < len(s) and s[l] == s[r]:
 l -= 1;
 r += 1
 return s[l + 1:r]

s = "babad"
sol = Solution()
sol.longestPalindrome(s)
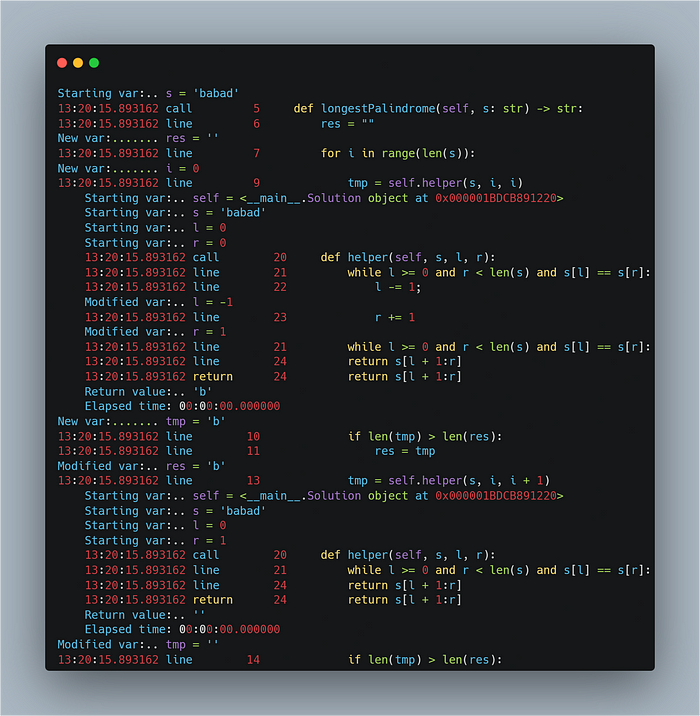
Let's try to dry run the above code; if we pass babad as the input string
res = ‘’ , now i = 0

res = ‘b’ , now i = 1

res = bab
i = 2
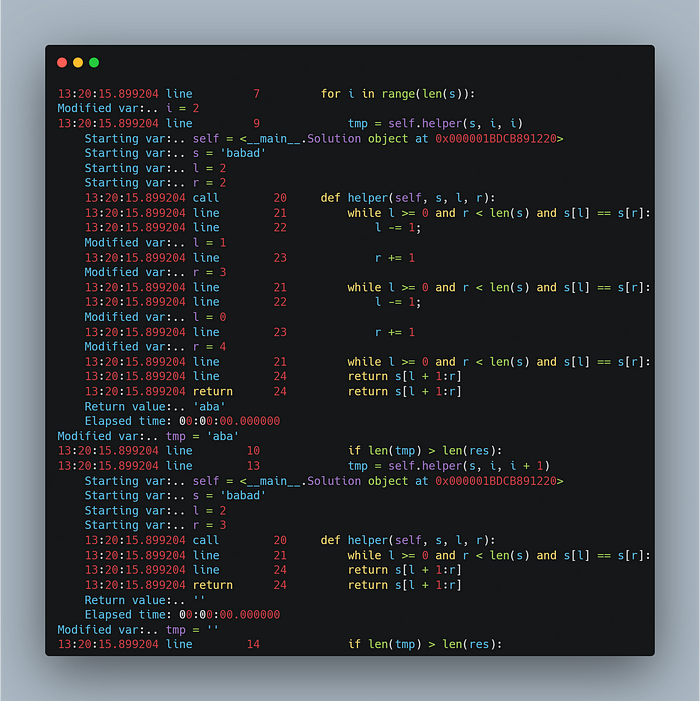
res = bab
for i = 3

res = bab
for i = 4
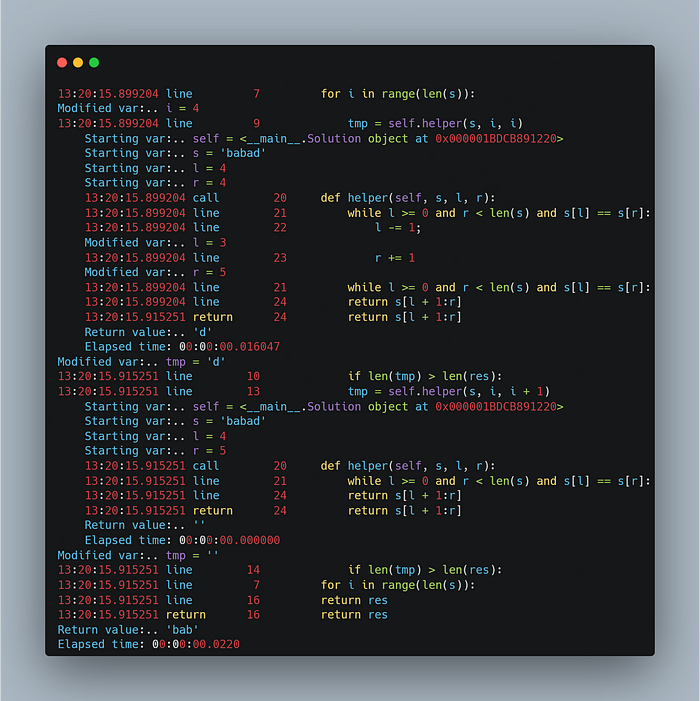
All the previously mentioned analyses can be effortlessly conducted by simply integrating a solitary line of code through the utilization of PySnooper.

How Does Pysnooper Work?
Pysnooper’s functionality is built around the concept of “snooping” on your code’s execution. By adding a decorator or context manager to your functions or code blocks, you enable Pysnooper to log various aspects of the execution. Here’s a basic overview of how Pysnooper works:
- Installation: Start by installing Pysnooper using
pip.
pip install pysnooper
2. Usage: You can use Pysnooper either as a decorator or a context manager. When you decorate a function or use the context manager in a code block, Pysnooper logs variable values and function calls as the code is executed.
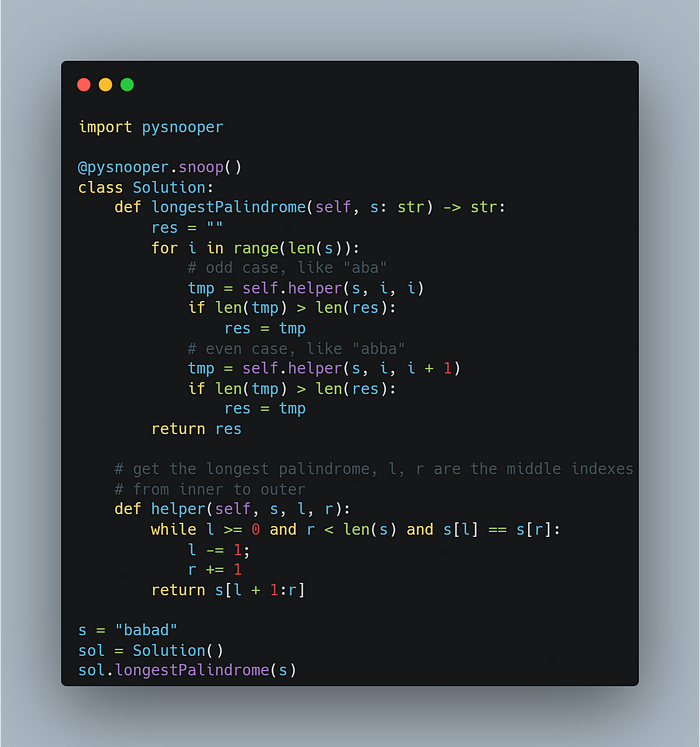
3. Output: When the code is executed, Pysnooper captures and displays detailed logs that include the values of variables, function arguments, return values, and execution times. This information is immensely helpful in understanding the code’s behavior and identifying issues.
4. Redirect to Log : If you’re finding the process of printing output to the screen a bit cumbersome, there’s a more streamlined alternative available. You can effortlessly direct your output to a log file, minimizing on-screen clutter and keeping your debugging process focused and efficient.
To achieve this, a simple adjustment to the decorator line is all it takes:
@pysnooper.snoop('/my/log/output.log')
Benefits of Using Pysnooper
- Real-Time Insights: Pysnooper provides real-time insights into your code’s execution, allowing you to see exactly what’s happening at each step. This can significantly reduce the time spent on manual debugging.
- Minimized Intrusiveness: Unlike traditional print statements that clutter your code, Pysnooper’s dynamic injection of logging statements keeps your codebase clean and readable.
- Granular Debugging: Pysnooper’s detailed logs allow you to trace the flow of your code, making it easier to pinpoint the source of errors and unexpected behavior.
- Function Call Analysis: By logging function calls and their arguments, Pysnooper makes it easier to understand how your functions interact with each other.
- Performance Insights: Pysnooper also logs execution times, helping you identify bottlenecks and performance issues in your code.
Conclusion
Incorporating PySnooper into your Python workflow elevates your debugging and analysis processes to new heights. The sheer simplicity of adding a single line of code brings forth a wealth of insights that otherwise necessitate complex setups. Embrace the efficiency and clarity that PySnooper offers, and revolutionize your approach to debugging and analysis.
Join thousands of data leaders on the AI newsletter. Join over 80,000 subscribers and keep up to date with the latest developments in AI. From research to projects and ideas. If you are building an AI startup, an AI-related product, or a service, we invite you to consider becoming a sponsor.
Published via Towards AI
Towards AI Academy
We Build Enterprise-Grade AI. We'll Teach You to Master It Too.
15 engineers. 100,000+ students. Towards AI Academy teaches what actually survives production.
Start free — no commitment:
→ 6-Day Agentic AI Engineering Email Guide — one practical lesson per day
→ Agents Architecture Cheatsheet — 3 years of architecture decisions in 6 pages
Our courses:
→ AI Engineering Certification — 90+ lessons from project selection to deployed product. The most comprehensive practical LLM course out there.
→ Agent Engineering Course — Hands on with production agent architectures, memory, routing, and eval frameworks — built from real enterprise engagements.
→ AI for Work — Understand, evaluate, and apply AI for complex work tasks.
Note: Article content contains the views of the contributing authors and not Towards AI.


