How to Evaluate a Data Visualization
Last Updated on July 24, 2023 by Editorial Team
Author(s): Benjamin Obi Tayo Ph.D.
Originally published on Towards AI.
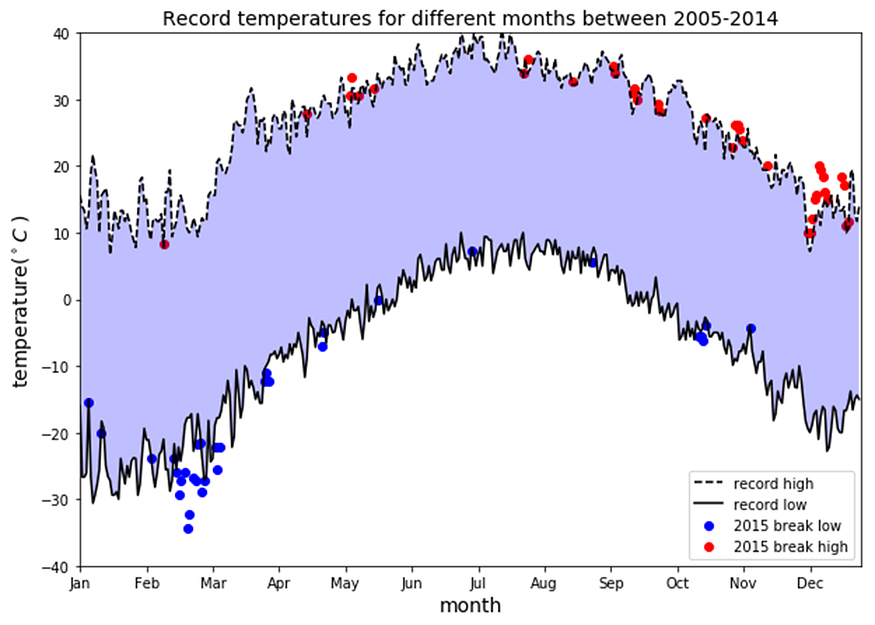
A good data visualization should have all essential components in place

Image by Benjamin O. Tayo
Data visualization is one of the most important branches in data science. It is one of the main tools use to analyze and study relationships between different variables. Data visualization can be used for descriptive analytics. Data visualization is also used in machine learning during data preprocessing and analysis; feature selection; model building; model testing; and model evaluation.
In machine learning (predictive analytics), there are several metrics that can be used for model evaluation. For example, supervised learning (continuous target) model can be evaluated using metrics such as the R2 score, mean square error (MSE), or mean… Read the full blog for free on Medium.
Join thousands of data leaders on the AI newsletter. Join over 80,000 subscribers and keep up to date with the latest developments in AI. From research to projects and ideas. If you are building an AI startup, an AI-related product, or a service, we invite you to consider becoming a sponsor.
Published via Towards AI


