ChatGPT Guide for Data Visualization: Top 80 Most Important Prompts
Author(s): Gencay I. Originally published on Towards AI. Unlock the power of data visualization in Python with Seaborn, Matplotlib, Plotly, and Bokeh: The ChatGPT Guide. Image by Author — Did you know that data visualization is a powerful tool for making sense …
Open Source Portfolio Tracking with yFinance API
Author(s): Sergei Issaev Originally published on Towards AI. No more logging in to numerous brokerages to get your current net worth Cryptocurrencies. Image by Stable Diffusion. Motivation Let’s face it — keeping track of all the places your net worth is split …
Data Visualization using Pandas, NumPy, and Matplotlib Python Libraries
Author(s): Likhitha kakanuru Originally published on Towards AI. Data Visualization To analyze which students secured the highest percentage in subjects like mathematics, physics, and chemistry we require a bar graph to display it. There are many ways to explore datasets. But in …
How to Evaluate a Data Visualization
Author(s): Benjamin Obi Tayo Ph.D. Originally published on Towards AI. A good data visualization should have all essential components in place Image by Benjamin O. Tayo Data visualization is one of the most important branches in data science. It is one of …
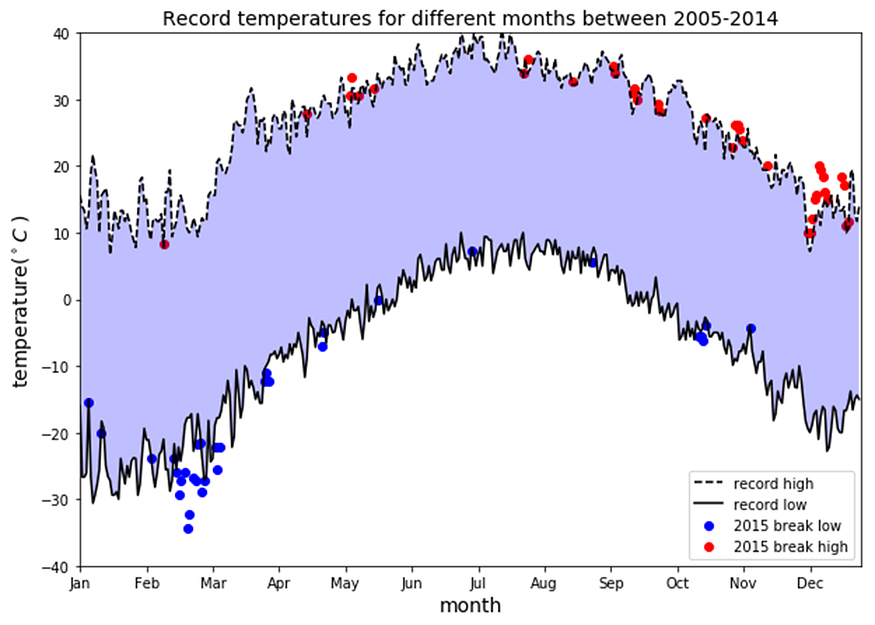
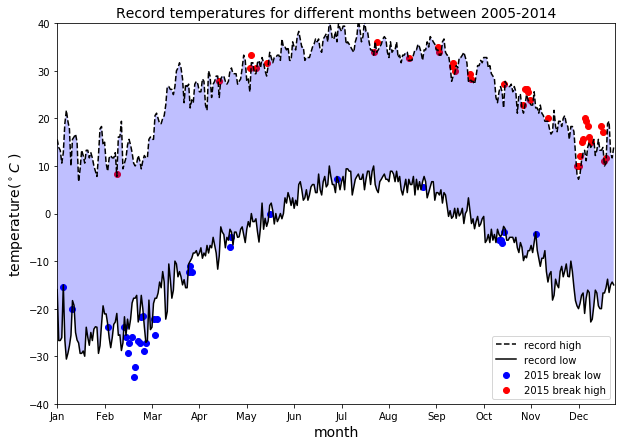
Tutorial on Data Visualization: Weather Data
Author(s): Benjamin Obi Tayo Ph.D. Originally published on Towards AI. Weather data analysis and visualization using Python’s Matplotlib Data Visualization is more of an Art than Science. To produce a good visualization, you need to put several pieces of code together for …


