Open Source Portfolio Tracking with yFinance API
Last Updated on July 17, 2023 by Editorial Team
Author(s): Sergei Issaev
Originally published on Towards AI.
No more logging in to numerous brokerages to get your current net worth

Motivation
Let’s face it — keeping track of all the places your net worth is split up can be a hassle. Perhaps you opened up too many bank accounts, or you own cryptocurrencies on multiple different exchanges/wallets (a common occurrence since some coins can only be bought on certain exchanges but not others).
What if there was a simple, one-click solution to get the live values of all your accounts? Not only would this save you from logging in to multiple websites (probably protected by 2FAU+1F644), but it can also help alert you if your stash of SHIB U+1F415 has finally shot to the moon! The last thing you want is to check up on your account and realize the price had skyrocketed a few months ago without you knowing.
Solution
Project Github: https://github.com/sergeiissaev/net_worth
By using the Yahoo Finance API, a simple tool could be built using Python that can multiply the amount of an asset you hold by the current market value of that asset. For example:
import yfinance as yf
print(yf.Ticker("AAPL").fast_info["last_price"])
Returns 126.36, the current market price of AAPL stock in USD.
Now, we can simply scale up this one-line code to cover all our assets.
Vision
Our tool will consist of the following:
- The user fills out their assets in .csv files.
- The program reads the .csv files, multiplies the price by the asset, then stores this information.
- Sum all the values to obtain the user’s net worth.
- Display a graph of the user’s net worth over time.
The entire project code can be found on the github here.
The Data
Pandas works very well with .csv files, and unlike Excel files, you don’t need to pay Bill Gates a subscription fee to create and save them. Therefore, we create a folder with all our .csv files, where each .csv file is one account/exchange/crypto wallet.

Next, we simply point to that folder in the code, and using Python we will recursively search that folder and all subfolders to obtain all the .csv data files.
To do so, we set data_files_path as an argument to our main class.
class NetWorth(_Template):
 data_files_path: Path

 def __init__(self, data_files_path: Path):
 self.data_files_path = data_files_path
 print("Welcome to your Net Worth Software.")
Fetching Current Value of Assets
Our public method, find_net_worth, is the main driver of the code and will loop over all given files and multiply the price by the amount.
def find_net_worth(self):
 """Main method for calling all subcategories of net worth"""
 for data_file in self.data_files_path.glob("**/*.csv"):
 df = pd.read_csv(data_file)
 file_type = int(df.type)
 file_name = data_file.stem
 if file_type == 1:
 self._process_csv_live_values(df=df, file_name=file_name)
 elif file_type == 2:
 self._process_csv_static_values(df=df, file_name=file_name)
 else:
 err = ValueError(f"Invalid file type: {file_type=}")
 logger.error(err)
 raise err
An if/else decision is taken based on the value in the column “type”- if the value is 1, we call a method called _process_csv_live_values, and if 2, we call _process_csv_static_values.
Setting the type in the .csv will allow the program to understand whether it should try multiplying by a ticker price to get a live value (for example, a stock), or if the contents of the .csv file have a static price (for example, a piece of artwork valued at $5000).
def _process_csv_static_values(self, df: pd.DataFrame, file_name: str) -> float:
 """Multiply amount of asset by value"""
 print("*******************************************")
 running_sum = 0
 for col in range(1, df.shape[1]):
 column = df.columns.to_list()[col]
 amount = df.iloc[0][column]
 running_sum += amount
 print(f"{'Current':<10} {column:<10} {'holding=$':<9}{amount:<50}")
 self.asset_dict[column][0] += amount # of asset
 self.asset_dict[column][1] += amount # in fiat
 self._print_running_sum(file_name=file_name, running_sum=running_sum)
 return running_sum
Above is the code for processing static values — it loops over all columns, sums all the amounts in a running_sum which is returned, and also prints the value of each individual holding using an f-string. Processing live values are very similar, but the amount is multiplied by the price fetched from yfinance API, as shown at the beginning of the article.
A self.asset_dict attribute was added to the class to store the total amount and dollar value of an asset in case you have the same asset in multiple locations (for example, if you have BTC in multiple wallets, at the end of the code execution you will get an output that shows your combined BTC holding).
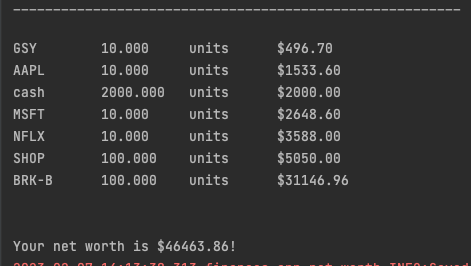
After code execution, the following is displayed in the terminal.

The final line on the bottom is generated by the _print_running_sum method (“The total sum for coinbase is $XXXX”), which also stores the exchange name and the sum of all its assets in a data structure called self.money_dict.
def _print_running_sum(self, file_name: str, running_sum: float) -> None:
 running_sum = round(running_sum, 2)
 self.money_dict[file_name] = running_sum
 print(f"The total sum for {file_name} is ${running_sum}")
 print("*************************************************************************************************")
Final Report
def _report_total_holdings(self) -> None:
 print("\n" * 3)
 print("Combined holdings for each asset (sorted)")
 print("________________________________________________________")
 print()
 for key, value in sorted(self.asset_dict.items(), key=lambda x: x[1][1]):
 print(f"{key:<10} {value[0]:<10.3f} units ${value[1]:<10.2f}")
 total = sum(self.money_dict.values())
 print(f"\n\nYour net worth is ${total:.2f}!")
After every file has been processed, the _report_total_holdings method is called, which prints in sorted order the name of the asset and the amount you have. This information is enumerated from the self.asset_dict dictionary, which stores the asset name/ticker as the key, with a corresponding value of list [asset_amount, asset_value_in_dollars].

Display Graphs
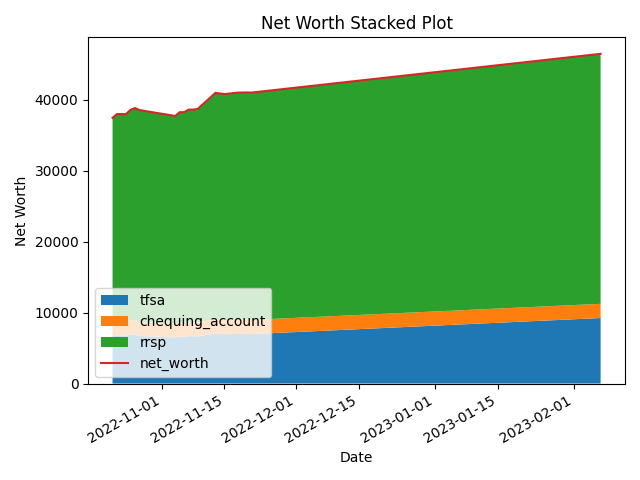
Lastly, we display a graph of our net worth so that we can notice trends over time in each of our asset locations.
def save_history(self) -> pd.DataFrame:
 """Save price history to csv and show plot"""
 date = datetime.today().strftime("%Y-%m-%d")
 net_worth = sum(self.money_dict.values())
 self.money_dict["date"] = date
 self.money_dict["net_worth"] = net_worth
 df_new = pd.DataFrame.from_dict(self.money_dict, orient="index").T
 df_new.date = pd.to_datetime(df_new.date)
 # If an existing net worth file is not found
 if not self.historical_net_worths.is_file():
 # If the entire folder is missing
 if not self.historical_net_worths.parent.is_dir():
 self.historical_net_worths.parent.mkdir(parents=True)
 # Ensure first two columns are date and net_worth
 df_new.insert(0, "net_worth", df_new.pop("net_worth"))
 df_new.insert(0, "date", df_new.pop("date"))
 df = df_new
 else:
 df = pd.read_csv(str(self.historical_net_worths), parse_dates=["date"])
 if date == df.at[df.shape[0] - 1, "date"].strftime("%Y-%m-%d"):
 # drop last row if last row was today
 df = df[:-1]
 df = pd.concat([df, df_new])
 for col in df.columns[1:]:
 df[col] = pd.to_numeric(df[col], errors="coerce")
 df.to_csv(str(self.historical_net_worths), index=False)
 logger.info("Saved net worth to history!")
 return df
We first save today’s results in a .csv file by calling the save_history method. If no saved history exists (this is the first time running the code on your computer), a new .csv file will be created. Otherwise, if a file exists, if no entry exists for today, today’s entry will be created. If this is the second time you ran the code today, rather than adding a second row for today, it will first delete the existing row for today and only then append a new row for today.
def _create_line_plot(self, df: pd.DataFrame) -> None:
 """Create line plot of net worth"""
 for col in df.columns[1:]: # skip date
 plt.plot(df.date, df[col], label=col)
 plt.title("Net Worth over time")
 plt.xlabel("Date")
 plt.xticks(rotation=30)
 plt.gca().xaxis.set_minor_locator(mdates.MonthLocator(bymonth=[4, 7, 10]))
 plt.ylabel("Net Worth")
 plt.legend(prop={"size": 6})
 plt.tight_layout()
 plt.savefig(Path("data", "processed", "net_worth_line_graph.png"))
 plt.show()

def _create_stacked_plot(self, df: pd.DataFrame) -> None:
 """Create stacked plot of net worth"""
 fig, ax = plt.subplots()
 ax.stackplot(df.date, df.iloc[:, 2:].T, labels=list(df.iloc[:, 2:].columns)) # skip date and net worth
 ax.plot(df.date, df.net_worth, label="net_worth")
 ax.legend(loc="lower left")
 ax.set_title("Net Worth Stacked Plot")
 ax.set_xlabel("Date")
 ax.set_ylabel("Net Worth")
 fig.autofmt_xdate()
 plt.tight_layout()
 plt.savefig(Path("data", "processed", "net_worth_stacked_graph.png"))
 plt.show()


Awesome! Now all that’s left to do is sit back and wait for our assets to moonU+1F680 U+1F315 Thanks for reading, and follow if you want to stay informed on future open-source projects!
Links:
Linkedin: https://www.linkedin.com/in/sergei-issaev/
Github: https://github.com/sergeiissaev
Kaggle: https://www.kaggle.com/sergei416
Medium: https://medium.com/@sergei740
Twitter: https://twitter.com/realSergAI
Learn more about Vooban: https://vooban.com/en
Join thousands of data leaders on the AI newsletter. Join over 80,000 subscribers and keep up to date with the latest developments in AI. From research to projects and ideas. If you are building an AI startup, an AI-related product, or a service, we invite you to consider becoming a sponsor.
Published via Towards AI
Take our 90+ lesson From Beginner to Advanced LLM Developer Certification: From choosing a project to deploying a working product this is the most comprehensive and practical LLM course out there!
Towards AI has published Building LLMs for Production—our 470+ page guide to mastering LLMs with practical projects and expert insights!

Discover Your Dream AI Career at Towards AI Jobs
Towards AI has built a jobs board tailored specifically to Machine Learning and Data Science Jobs and Skills. Our software searches for live AI jobs each hour, labels and categorises them and makes them easily searchable. Explore over 40,000 live jobs today with Towards AI Jobs!
Note: Content contains the views of the contributing authors and not Towards AI.


