


Statistics 101- Part 3- Non-parametric Statistics, Their Types, and Applications
Last Updated on October 12, 2022 by Editorial Team
Author(s): Kumar kaushal
Originally published on Towards AI the World’s Leading AI and Technology News and Media Company. If you are building an AI-related product or service, we invite you to consider becoming an AI sponsor. At Towards AI, we help scale AI and technology startups. Let us help you unleash your technology to the masses.
Introduction to Non-Parametric Statistics, different types of Non-Parametric tests, and their applications
This is the third part of the series Statistics 101, where concepts of Non-Parametric statistics will be explained in detail. In the real world, we may not always get a well-defined data distribution such as a normal distribution. In such cases, we have to deploy Non-Parametric statistics.
In part one of the Statistics 101 series, it was mentioned that hypothesis testing for sample data that is not normally distributed would involve a different set of distributions such as Mood’s Median tests- an example of non-parametric tests.
Contents
- Definition
- Types of Non-Parametric tests
- Applications
- Non-parametric models in Machine Learning
Definition
When we talk about normal distribution, we make some assumptions about the population from which samples have been drawn out. In contrast to these assumptions, Non-Parametric statistics do not make such assumptions regarding the shape of the population distributions. Hence, these are also known as Distribution-free statistics. Apart from the advantage of not making any assumption of distribution shape, these statistics do not require as much computations efforts as required by parametric methods.
These methods have their own disadvantages too. They don’t capture as much information as captured by parametric methods. If we are representing a list of values like 190.2, 202.45, 345.56 as 1,2 and 3, then we may have missed out on some information.
Types of Non-Parametric tests
- Sign test
- Rank Sum test
- One sample Runs test
- Rank Correlation
- The Kolmogorov-Smirnov test
Let us detail these tests:
- Sign test
It relates to the direction of a pair of observations in terms of positives or negatives instead of their values. For example, if we have pair of weights before and after a workout program and we calculate the number of instances of difference in the weights before and after the program is positive or negative. Here, the null hypothesis would be that there is no difference between the weights, and the alternate hypothesis would be that there is a difference in the weights. Please note the simplicity in calculating differences and determining whether it is a positive or negative number. Implementation of the sign test can be referred to here.
2. Rank Sum test
To conduct an analysis of variance tests, we assume that the populations are normally distributed with equal variances. However, when these conditions are not met, we use the Rank Sum test. The Mann–Whitney test is to be used when there are two populations, and the Kruskal–Wallis test is to be used when there are more than two populations. Here, the term rank arises as each data point in the samples is ranked and the U-statistics is calculated.
Below are the hypotheses for the Mann-Whitney test:
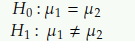
The formula for U-statistics for a two population-based scenario is shown below:
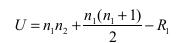
where n1= number of data points in sample 1, n2= number of data points in sample 2, and R1= sum of ranks of each data point in sample 1.
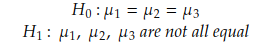
For the Kruskal-Wallis test, below are the hypotheses:
In this case, K-statistics is used:
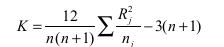
where, n= sum of the number of data points in all the samples, j=sample j, and Rj= sum of ranks of all data points in sample j.
3. One sample runs a test
Most of the time, we assume that the sample has been randomly selected. However, this may not always be true. Assume a scenario where we have to draw samples of red and green balls from a bag full of many balls. We came up with the below sample ( Green-G, Red-R):
RRR GGG RRR GGG RR GG
The above sample may not be randomly generated. To test samples for their randomness, we have run the test.
Here, the null hypothesis is that the items (i.e., balls) are randomly mixed, and the alternate hypothesis is that the items are not randomly mixed.
A run is a sequence of the same occurrences. In the above example, RRR is a run, and GG is also a run.
4. Rank Correlation
Rank correlation joins the idea of correlation and rank together, where it can measure the correlation between two sets of ranks in terms of similarity between them.
If we have a list of six countries and their ranks in terms of their GDP ( Gross Domestic Product) and HDI ( Human Development Index), the rank correlation is calculated as:
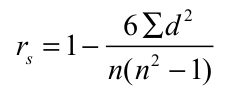
where d = difference between ranks between each pair of countries, n= number of paired observations ( here it is six). A value of 1 represents a perfect association between the two variables. Here, the null hypothesis states that there is no correlation in the ranked data of the population and the alternate hypothesis states that there is a correlation in the ranked data.
5. The Kolmogorov-Smirnov (K-S) test
The Kolmogorov-Smirnov test is to be used in cases where we want to test if there is a significant difference between two samples or if the observed frequency distribution is the same as the theoretical distribution. It means this test can be used to measure the goodness of fit, very similar to the Chi-Square test. Using cumulative distribution, it decides the specific distribution of the population.
Apart from the above types, there are many other tests as well, such as Kuiper’s test, Tukey–Duckworth test, log-rank test, and others.
Applications
These tests can be applied to situations where a business manager or anyone else has to make a decision or test some assumption. Non-parametric tests are widely used in cases when the assumptions associated with the data specific to parametric tests are not met, the sample size is quite small, and the data is nominal or ordinal such as ranked orders.
Additional notes: Non-parametric models in machine learning
Similarly, non-parametric algorithms don’t make any assumptions about the relationship between input and output data. The non-parametric algorithms are not having a fixed number of parameters but depend on the amount of training data. Linear regression is an example of a parametric algorithm, and K-nearest neighbors are an example of a non-parametric algorithm.
Follow me (kumarkaushal.bit) for more interesting topics related to Data Science and Statistics.
References
- Statistics 101-Part 1-What is Hypothesis testing ?
- Sign test – Wikipedia
- Mann Whitney U Test (Wilcoxon Rank Sum Test)
- One sample runs test
- Rank correlation – Wikipedia
- Kolmogorov-Smirnov test – Wikipedia
Statistics 101- Part 3- Non-parametric Statistics, Their Types, and Applications was originally published in Towards AI on Medium, where people are continuing the conversation by highlighting and responding to this story.
Join thousands of data leaders on the AI newsletter. It’s free, we don’t spam, and we never share your email address. Keep up to date with the latest work in AI. From research to projects and ideas. If you are building an AI startup, an AI-related product, or a service, we invite you to consider becoming a sponsor.
Published via Towards AI
Towards AI Academy
We Build Enterprise-Grade AI. We'll Teach You to Master It Too.
15 engineers. 100,000+ students. Towards AI Academy teaches what actually survives production.
Start free — no commitment:
→ 6-Day Agentic AI Engineering Email Guide — one practical lesson per day
→ Agents Architecture Cheatsheet — 3 years of architecture decisions in 6 pages
Our courses:
→ AI Engineering Certification — 90+ lessons from project selection to deployed product. The most comprehensive practical LLM course out there.
→ Agent Engineering Course — Hands on with production agent architectures, memory, routing, and eval frameworks — built from real enterprise engagements.
→ AI for Work — Understand, evaluate, and apply AI for complex work tasks.
Note: Article content contains the views of the contributing authors and not Towards AI.
Related posts
Recent Posts


")

