


Different Ways To Find Outliers in the Data and How To Remove Them Using Interquartile Statistics.
Last Updated on December 1, 2022 by Editorial Team
Author(s): Ashbab khan
Originally published on Towards AI the World’s Leading AI and Technology News and Media Company. If you are building an AI-related product or service, we invite you to consider becoming an AI sponsor. At Towards AI, we help scale AI and technology startups. Let us help you unleash your technology to the masses.
Different Ways To Find Outliers in the Data and How To Remove Them Using Interquartile Statistics
Outliers are the data points or observations far from other data points or very different from other data points.
Why remove outliers from the data
Outliers cause so much miscalculation when we use statistics on the data; let's say we have data with many outliers, and we are taking the Mean of the data, and some data points are much larger than the remaining data points then our mean value is going to be very different from actual mean for example the mean value without outlier is 5.6. due to outliers, it becomes 6.1, but this is one example. Imagine getting miscalculated values when using different statistics, so it is essential to check for outliers and try removing them.
Spotting outliers in data using boxplot
Boxplot is a great way to see much statistical information in our data, such as 0,25th,50th,75th, and 100 percentile values, also known as five summary statistics;
Five summary statistics are also known as quantiles which give a summary of the datasets such as variance in datasets, minimum values, maximum values, and Median, and also help us find outliers in the data.
We use the Mean value a lot to find the center of the data, but sometimes our datasets contain so many values which are so much different from the remaining values these values are also known as an outlier.
Let’s say we have data 2,3,4,6. If we find the mean value, it will give us a weight of 3.75, so this is an excellent value representing all the datasets. Still, what if the data is 2,3,4,6,38? Then, in this case, the mean value is near 10.6. This is not a good measure of representing the data, so in this type of data mean value doesn’t work. We need to use the Median. so let’s see what the median is and how the concept of median helps us to calculate another quartile. so quartile is just a single value such as 0.25 or 0.75 etc.
Let’s see what these five statistics are
These five statistics are
- 0 (Minimum value)
- 0.25 (Median of the first half of the data)
- 0.50 (Median of the total data)
- 0.75 (Median of the second half of the data)
- 1 (Maximum value)
The three essential quartiles are 0.25, 0.50, and 0.75, so let’s discuss these quartiles and how it helps us in calculating variance in our data. So some might you think, why not calculate variance using standard deviation? We can figure it out using std, but this gives us variance in the data. We don’t want that. We want the variance only between our 25th percentile data and 75th percentile data because we don’t want to include outliers in our data.
If you are unfamiliar with variance, then the variance tells us the values in the datasets are closely packed or very far away from each other, let’s say 1, 2, 3, 4. The variance in this is low, but in 1, 3, 6, and 9 then, the variance in this data is high compared to the previous one.
So how to calculate 0.25 or 25th percentile? So let’s say we have our previous data 2, 3, 4, 6, 38. The center value, which is 4, is the Median. Then divide the data into two parts 2, 3, 4 and 4, 6, 38. Take the Median of the first part of the data. This gives us 3, so 3 is the 25th percentile value, and taking the Median of the second part of the data shows us 6. This value is the 75th percentile value.
The median value represents the center of the total data; the 25th percentile shows the center of the first half of the data, and the 75th percentile indicates the center of the second half of the data.
We also calculate the interquartile range using these two statistics by simply subtracting the 25th percentile from the 75th. This gives us a value of IQR. If IQR is a significant value, we will say that variance is directly proportional to IQR. If the IQR value increases, the variance also increases, so below is a boxplot image showing our summary statistics using a diagram.
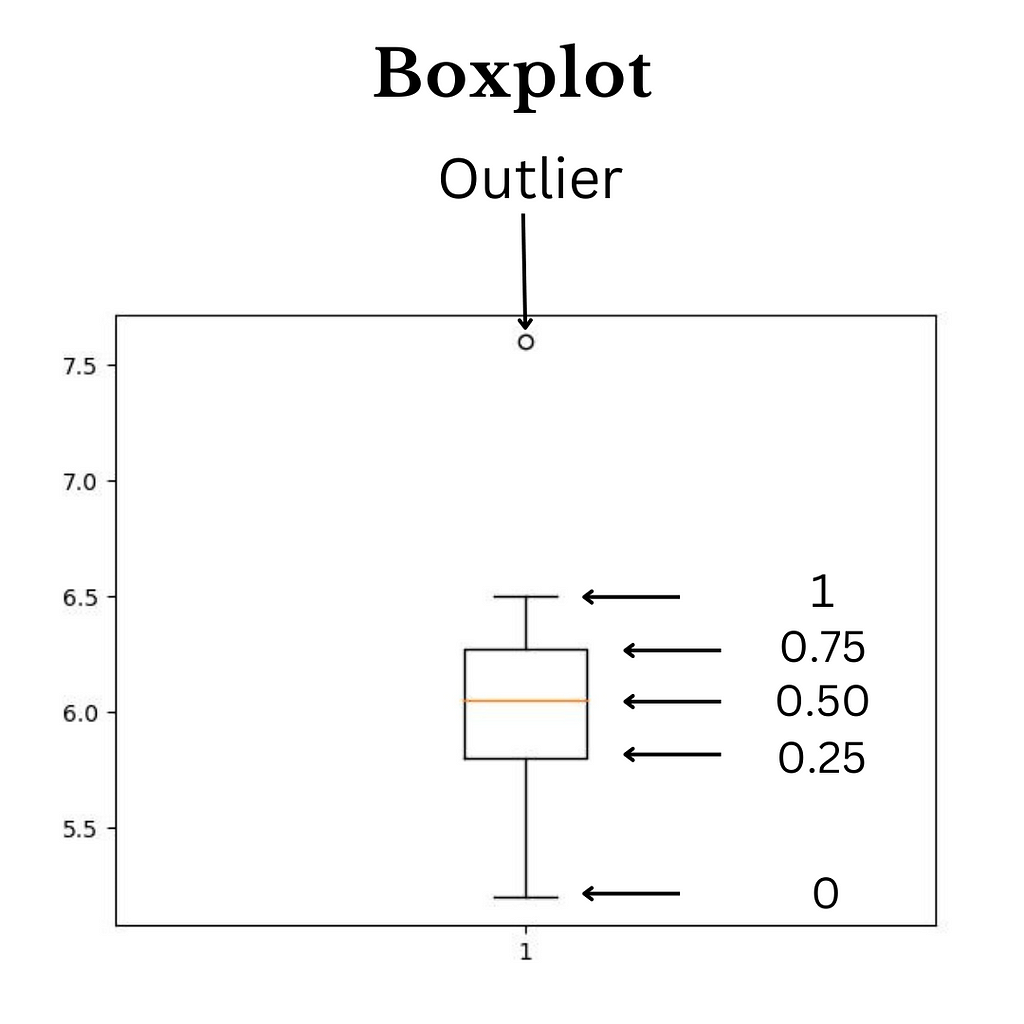
So that's how the boxplot looks. We can easily spot the outliers in the data and quartile values, the yellow horizontal line denoting the Median, and other quartile values such as 0.25,0.75,1, etc.
So let's remove these outliers from the data using interquartile statistics.
The interquartile statistic is a way to find outliers in the data using the 25th and 75th percentile values, which we already discussed. So, how do we find the rows which contain outliers?
So to extract outliers, we need two values
1. 25th percentile value
2. 75th percentile value
and why we need these two values because the Interquartile range is the distance between the 25th percentile and the 75the percentile value, so let's find out these two values first; we need to import the Numpy library, which is used for doing numerical works in python.
# importing numpy libraries as np
import NumPy as np
We talked about the 25th and 75th quartile in detail theoretically; let's see how to find these values practically using NumPy libraries, so below are two codes. There is a method in NumPy, which is called quantile(). This method is used to find the value of the quartiles, such as, in our case, we want the value of the 25th and 75th percentile of the Height column.
# Finding values of 25th percentile value
Q1 = np.quantile(data['Height'],0.25)
# Finding the value of 75th percentile value
Q3 = np.quantile(data['Height'],0.75)
What the above syntax does is that it simply sorts the Height column and stores the 25th percentile value in Q1 and the 75th percentile value in Q3 to find the Interquartile statistic (IQR) value; we need to find the difference between Q3 and Q1.
# Finding the difference between Q3 and Q1
IQR = Q3 - Q1
Now we calculated the (IQR) the next step is to calculate the two threshold values, thresh1, and thresh2, using IQR these threshold values are used to find outliers; any value which is less than thresh1 or greater than thresh2 is considered an outlier.
# Calculating thresh1 value
thresh1 = Q1 - 1.5*IQR
# Calculating thresh2 value
thresh2 = Q3 + 1.5*IQR
Now we get the value of the thresh1 and thresh2. The next step is to subset the rows in which the Height Column is smaller than thresh1 or greater than thresh2, and that's it
# Extracting the outlier from our data
data[( data['Height'] < thresh1 ) | ( data['Height'] > thresh2)]
now we successfully extracted the outliers from the data. Thank you for reading this article. You can also connect with me on LinkedIn.
Different Ways To Find Outliers in the Data and How To Remove Them Using Interquartile Statistics. was originally published in Towards AI on Medium, where people are continuing the conversation by highlighting and responding to this story.
Join thousands of data leaders on the AI newsletter. It’s free, we don’t spam, and we never share your email address. Keep up to date with the latest work in AI. From research to projects and ideas. If you are building an AI startup, an AI-related product, or a service, we invite you to consider becoming a sponsor.
Published via Towards AI
Towards AI Academy
We Build Enterprise-Grade AI. We'll Teach You to Master It Too.
15 engineers. 100,000+ students. Towards AI Academy teaches what actually survives production.
Start free — no commitment:
→ 6-Day Agentic AI Engineering Email Guide — one practical lesson per day
→ Agents Architecture Cheatsheet — 3 years of architecture decisions in 6 pages
Our courses:
→ AI Engineering Certification — 90+ lessons from project selection to deployed product. The most comprehensive practical LLM course out there.
→ Agent Engineering Course — Hands on with production agent architectures, memory, routing, and eval frameworks — built from real enterprise engagements.
→ AI for Work — Understand, evaluate, and apply AI for complex work tasks.
Note: Article content contains the views of the contributing authors and not Towards AI.
Related posts
Recent Posts
")


")


