Using the Indian Number System Notations in Plotly Plots
Author(s): Rahul Shah Originally published on Towards AI. Plotly is a versatile library that offers a comprehensive suite of resources for data visualization. Its ability to customize charts to meet user needs has made it a favorite of many analysts and data …
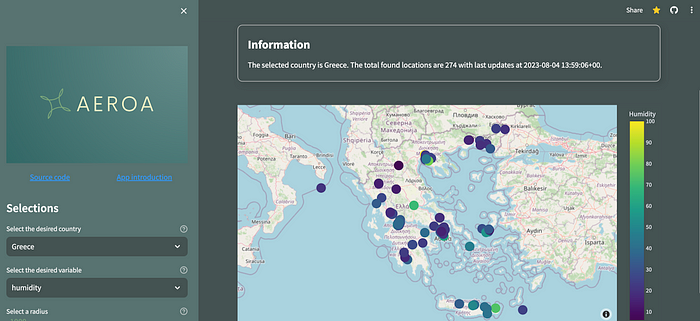
Empowering Your App with Streamlit’s New Connections Feature and Interactive Plotly Maps
Author(s): Stavros Theocharis Originally published on Towards AI. Aeroa: An app for air quality visualizations Image created by the author Introduction Streamlit recently, and at the time that this article is being written, announced its new feature, st.experimental_connection, and I was very …
Tweet Topic Modeling: Visualizing Topic Modeling Results with Plotly
Author(s): John Bica Originally published on Towards AI. Multi-part series showing how to scrape, preprocess and apply & visualize short text topic modeling for any collection of tweets Disclaimer: This article is only for educational purposes. We do not encourage anyone to …
Data Visualisation using Pandas and Plotly
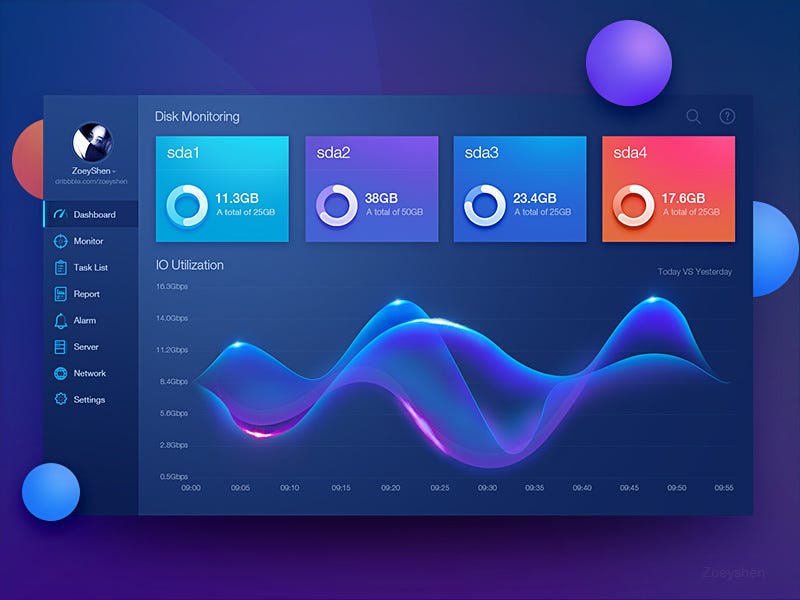
Author(s): Saiteja Kura Originally published on Towards AI. Source — Dribbble Let us imagine you are trying to convince a client to invest in your company. You exhibit all the employee’s records and their achievements in the form of an excel sheet …
Analysing Whatsapp Group Chats using StreamLit— Part II
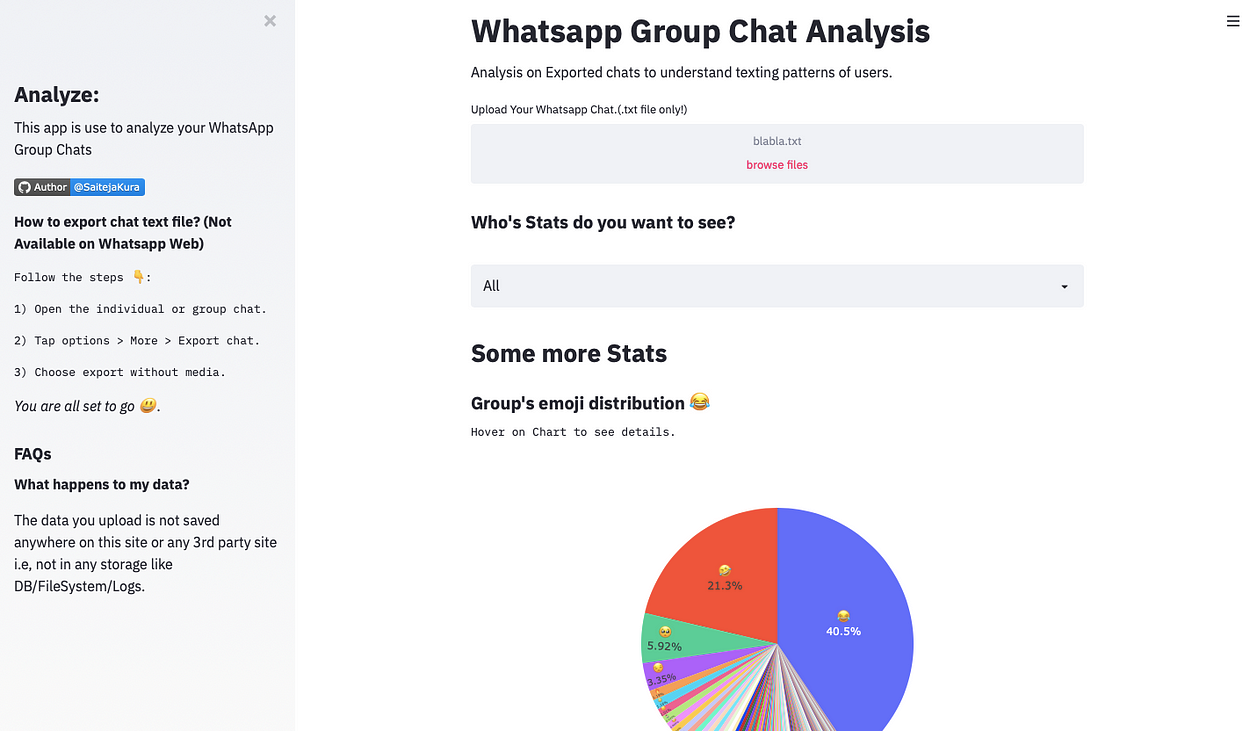
Author(s): Saiteja Kura Originally published on Towards AI. The output — A screenshot the web app. Don’t be satisfied with “almost” completing a task. Continue until you complete it. In data science, it is important to work on real-time projects. It is …
Modular Prompt Engineering GPT-4 For Interactive Python Web Apps
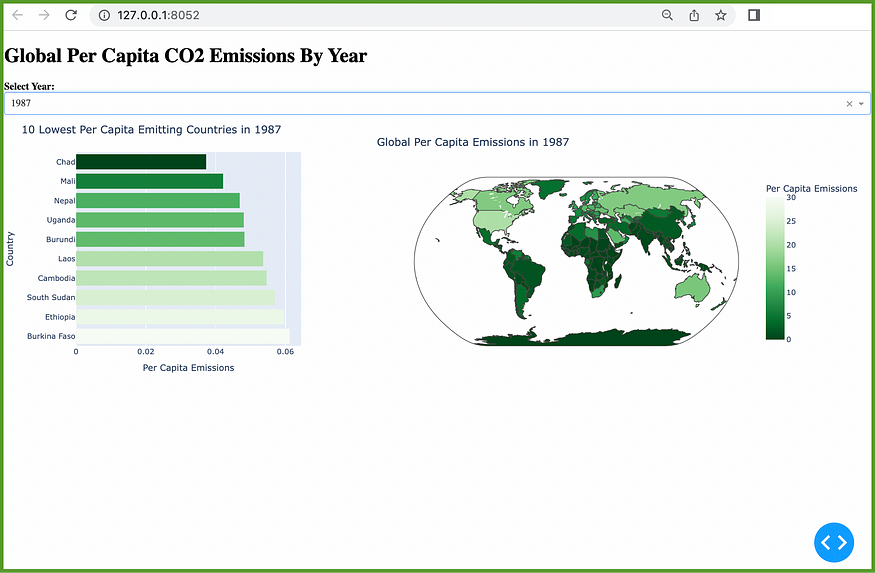
Author(s): John Loewen, PhD Originally published on Towards AI. Interactive global CO2 emissions data visuals in 4 easy steps Fully Interactive Python plotly web application created using modular prompt engineering ChatGPT is revolutionizing how we create complex data visualizations, letting us easily …
Half Marathon Data Exploration and Visualization: using Python Plotly Library
Author(s): David Cullen Originally published on Towards AI. London Landmarks Half Marathon 2023 In April of this year, I ran the London Landmarks Half Marathon for the first time. The race included 17,225 registered participants between the ages of 17–89 and managed …
COVID-19 Lockdown Impact Analysis
Author(s): Saiteja Kura Originally published on Towards AI. Analyze how the COVID-19 lockdown has effected daily movement using Google’s Community Mobility data. Photo by Falaq Lazuardi on Unsplash LOCKDOWN! I never heard of this word until March 2020. I was startled by …


