Logo:
Logo:  Areas Served:
Linear Regression Explained
Last Updated on July 24, 2023 by Editorial Team
Author(s): Daksh Trehan
Originally published on Towards AI.
Explaining Linear Regression as easy as it could be.
It is often the first machine-learning algorithm to be taught due to its fundamental nature. It is part of Supervised Learning that means the data required will be labeled. Regression refers to predicting continuous value. As the name suggests, it is a linear model; that is, it can only fit linear data points. There are two types of Linear Regression:- Simple and Multiple.
Simple Linear Regression
Simple linear regression is useful for finding the relationship between two continuous variables. One variable is a dependent or predictable variable, and another is an independent variable.
Input provided to the model will be one or more number of features and predicted output would be a real number.
The core idea is to obtain a line that best fits the data. The best fit line is the one for which total prediction error (all data points) are as small as possible. Error is the distance between the point to the regression line or, in simple words, the difference between predicted and theoretical value.

The most basic example for Linear Regression is predicting house prices where, as input, we are provided with different features such as the number of rooms, sq. Ft area of the house, locality type, convenience, and many more, and we are expected to predict the price of the house based on the inputted features.
The first thing that the linear model reminds us is of a line, and the equation for a line is

where
c=constant, m=slope
x=independent feature, y= dependent feature
The whole concept of Linear regression is based on the equation of a line. The equation for a line in Linear Regression is regarded as :
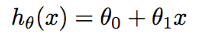
The goal of the algorithm is to learn theta0, theta1, and h(x).
The steps for the algorithm is as follows:-
- Randomly initialize theta0 & theta1.
- Measure how good is theta since it is supervised learning, so we’ll be given labeled data; thus, we can easily get error presented by an algorithm using Mean Squared Error J(theta).
We’re using mean squared error and not a mod error as it isn’t differentiable; the whole error is divided by 2 for sake of convenience.
3. Update theta so that J(theta) decreases, and we get the best line.
To get the best line, we’ll be using the Gradient Descent algorithm.
Once we get satisfying results i.e., we notice error is minimized. We’ll be updating theta0 and theta1 with the same hyperparameters.
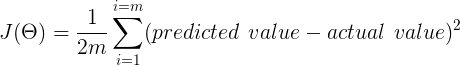
Cost function J(theta)

The cost function for Linear regression is:-

To make it more clear, it can be written as:-
Here m means the total number of examples in your dataset. In our example, m will be the total number of houses in our dataset.
Now our goal is to reduce our cost function. That’s the loss to get an accurate fit as possible. To do that, we’ll use a Gradient Descent algorithm.
Gradient Descent
This is an as far most crucial algorithm in Machine Learning as well as Deep Learning. It is used to diminish the loss by subtracting it with the partial derivative of our cost function w.r.t the weight.

Let’s visualize how gradient descent helps us to minimize the loss function.
Our aim is to reach local minima in order to decrease the loss.
Currently, our position is a redpoint, and our goal is to reach local minima. In order to achieve that, it is required that we must take some steps whose measure is determined by the user and is depicted as a learning rate(alpha).
Once we have started the training, we can visualize the loss in order to confirm we are taking steps in the right direction, and we are getting the desired output. Once confirmed, we will iterate those steps until satisfied.
Once we get to local minima, it means we have accomplished our goal, and loss is attenuated now. We can expect our model to have better accuracy.
Final model
Once our cost function is defined, we perform gradient descent algorithm to minimize the loss, and we keep on repeating until we get to local minima.
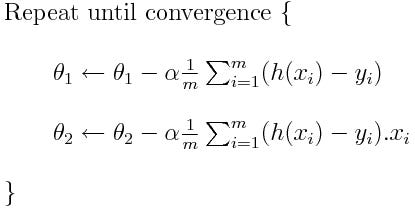
Where n(alpha) is the learning rate i.e., the length of steps to be taken while decreasing the loss.
Now the output for our algorithm will be the price of the house, and that depends upon theta0(constant) and theta1. Now relating it to real life, so in short:-

Multiple Linear Regression

Multiple Linear Regression is used when we want to predict the value of the variable based on two or more variables.
Suppose if the price of the house would also depend upon the number of rooms alongside the size of the house, then we’ll implement Multiple Linear Regression, which isn’t much different than Vanilla Linear Regression.
Ways to achieve a good fit for our model
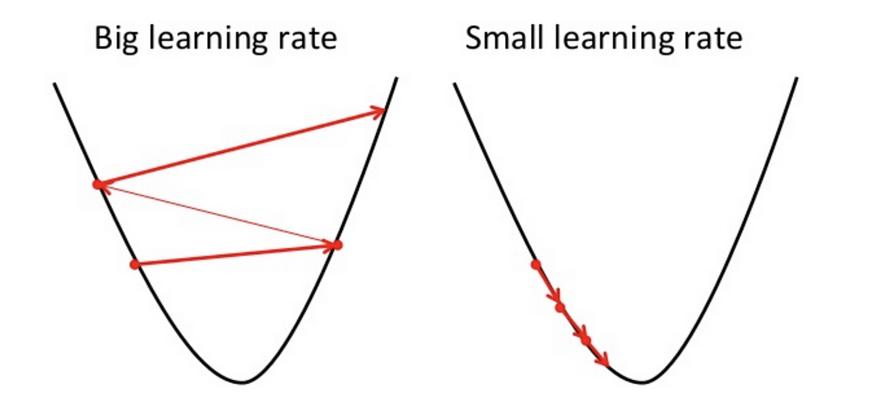
Another essential thing to keep in mind while implementing linear regression is a careful decision of hyperparameter i.e., n(learning rate).
If n is small, more no. of steps, slow training.
If n is large, less no. of steps, fast training.
If n is very large, it’ll oscillate and no output will be predicted.
We can avoid overfitting by complicating the model i.e., adding more features to our model. For instance if our model’s equation is y=theta0+theta1(x) make it y=theta0+theta1(x)+theta2(x²)+theta3(x³)…
For a more detailed explanation over choosing hyperparameters to follow: Determining the perfect fit for your ML model.
Some key features of Linear Regression:-
- Target is an interval variable.
- Predicted values are the mean of target variables.
Code using Sci-kit Learn for Linear Regression.
While using frameworks as sci-kit learn, we don’t need to focus much on error or other values to be initialized. They’re already chosen by frameworks, but it is good to know the mathematics part behind the algorithm.
For Linear Regression code from scratch follow:-
dakshtrehan/machine-learning-online-2018
Permalink Dismiss GitHub is home to over 40 million developers working together to host and review code, manage…
github.com
Conclusion
Hopefully, this article has not only increased your understanding of Linear Regression but also made you realize machine learning is not difficult and is already happening in your daily life.
As always, thank you so much for reading, and please share this article if you found it useful! 🙂
Check my other articles:-
Detecting COVID-19 using Deep Learning.
Determining perfect fit for your ML Model.
Serving Data Science to a Rookie.
Relating Machine Learning techniques to Real Life.
Feel free to connect:
Portfolio ~ dakshtrehan.com
LinkedIN ~ https://www.linkedin.com/in/dakshtrehan/
Instagram ~ https://www.instagram.com/_daksh_trehan_/
Github ~ https://github.com/dakshtrehan
Follow for further Machine Learning/ Deep Learning blogs.
Cheers.
Join thousands of data leaders on the AI newsletter. Join over 80,000 subscribers and keep up to date with the latest developments in AI. From research to projects and ideas. If you are building an AI startup, an AI-related product, or a service, we invite you to consider becoming a sponsor.
Published via Towards AI
Related posts
Popular posts

 for 2021")


Updates

Recent Posts