


Basic Concepts of statistics that every Data scientist should know.
Last Updated on July 25, 2023 by Editorial Team
Author(s): Rohini Vaidya
Originally published on Towards AI.
It’s easy to lie with statistics, It’s hard to tell the truth without statistics.
Hey, are you planning to learn data science? Then let’s go through some basic statistical concepts.
In this series, I am trying to cover all statistics concepts required for data science.
Part 1
Statistics is the science of collecting, organizing, and analyzing data.
We can classify the statistics into two types: descriptive and inferential.
- Descriptive statistics: Organizing and summarizing of data. PDF, Histogram, and bar charts are examples of descriptive statistics.
- Inferential statistics: It is used to make conclusions from the data. We use Hypothesis testing, Z-test, and T-test for inferential statistics.
Data is a fact or piece of information.
There are two terms for data i.e., Population data(N) and sampling data(n). Population data is the entire group of data used to conclude. And sampling data is the specific group of data from population data.
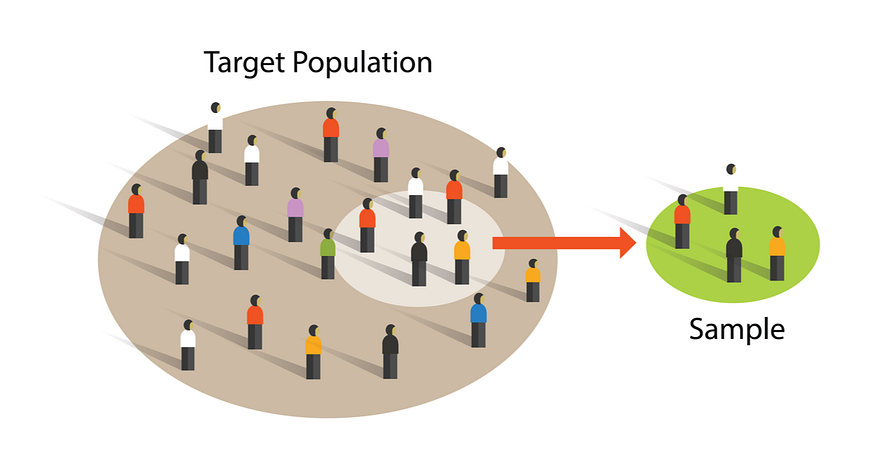
We can get these samples using different sampling techniques. Below are some sampling techniques which we can use for sampling our population data.
- Simple Random Sampling: Every member of the population(N) has an equal chance of being selected for your sample(n).
- Stratified Sampling: Population data(N) is subdivided into nonoverlapping subgroups(n). e.g., Gender can be classified into male and female, i.e., nonoverlapping sample data.
- Systematic sampling: Systematic selection of sampling data from population data. Every nth individual is selected for sampling data.
A variable is a characteristic that can take any value which can be measured.
A variable can be classified into a Numerical variable and a Categorical variable.
- A numerical variable is a quantifiable characteristic whose value can be measured. e.g., age, rank, etc.
- A categorical variable is a qualitative variable in which there is no intrinsic ordering of the categories.
Frequency Distribution is an overview of all values of some variable and the number of times it occurs.
It can be represented by a bar graph, histogram, Probability Density Function(PDF), etc.
- Bar plot: It is used to represent the distribution of data. It is a way of visualizing the number of occurrences of different values within a set of data. In a bar plot, the x-axis represents the different values or categories in the dataset, and the y-axis represents the frequency or count of those values. This type of plot is useful for quickly understanding the distribution of a dataset and identifying patterns or outliers.
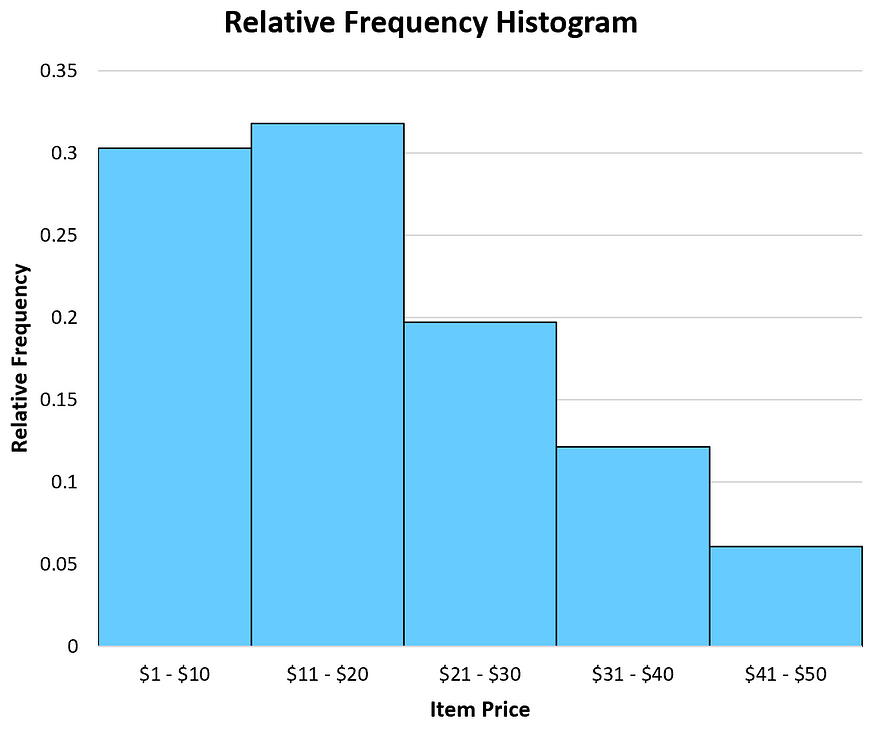
2. Histogram: A histogram is a type of graph used to represent the distribution of a dataset. It is similar to a bar plot in that it displays the number of occurrences of different values within a set of data, but it is typically used to represent continuous data rather than discrete data. However, unlike a bar plot, the x-axis is divided into a series of bins or ranges, and the height of each bar represents the number of data points that fall within that bin. This allows the histogram to show the distribution of continuous data, such as measurements or ages, by grouping them into ranges. The overall shape of the histogram can give insight into the underlying distribution of the data, such as whether it is symmetric or skewed.

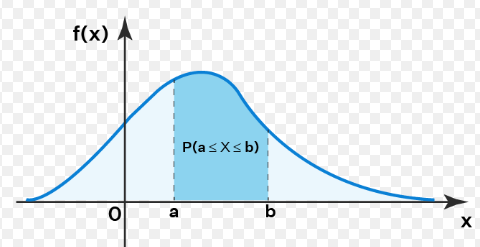
3. Probability Density Function(PDF): It is a function that describes the probability of a random variable taking on a given value. It is a smooth curve that describes the probability of observing a value within a small range rather than the probability of observing a specific value.
The measure of central tendency is used to describe a data set’s center or typical value and can be used in understanding and summarizing the data.
There are several measures of central tendency measures including mean, median, and mode.
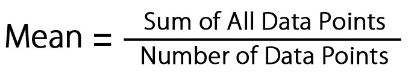
- Mean: Average value, i.e., the sum of all values in a data set divided by the total number of values in a data set, is termed as the mean of data.
import statistics as st
data =[1,40,5,4,3]
mean = st.mean(data)
print("mean of given data is:",mean)
The output of the above code is,
mean of the given data is: 10.6
2. Median: A sorted dataset’s middle value is called a dataset’s median value.
import statistics as st
data =[1,40,5,4,3]
median = st.median(data)
print("median of the given data is:",median)
The output of the above code is,
median of the given data is: 4
3. Mode: The most frequently occurring element in a dataset.
import statistics as st
data =[1,40,40,5,4,3]
mode = st.mode(data)
print("mode of the given data is:",mode)
The output of the above code is,
mode of the given data is: 40
The measure of dispersion is a statistical value that describes how spread out a dataset is.
There are several types of measures of dispersion, including Range, Variance. This measure of dispersion is used to describe how similar or different the values in the data set are, and they can be useful in understanding and summarizing data.
- Range: The range is the difference between the largest and smallest observation in the data.
Range = Maximum value in a data — Minimum value in a data
import statistics as st
data =[1,40,40,5,4,3]
Range = max(data) - min(data)
print("The Range of the given data is:",Range)
The output of the above code is,
The range of the given data is: 39
2. Variance: Variance is a numerical value that signifies the spread of your data from the arithmetic mean value.


import statistics as st
data =[1,40,40,5,4,3]
Variance = st.variance(data)
print("A Variance of the given data is:",Variance
The output of the above code is,
A variance of the given data is: 361.9
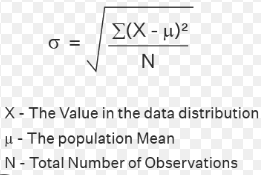
3. Standard deviation: Standard deviation is the numerical value that gives the dispersion of data from the mean value, i.e., how much your data point deviates from the mean value.

import statistics as st
data =[1,40,40,5,4,3]
Standard_deviation = st.stdev(data)
print("Stanard deviation of the given data is:",Standard_deviation)
The output of the above code is,
The standard deviation of the given data is: 19.023669467271553
In this blog, I covered very basic concepts of statistics. I am planning to cover all the statistics concepts that are required for data science in my upcoming blogs.
If you found this article insightful, follow me on Linkedin and medium. you can also subscribe to get notified when I publish articles.
Stay tuned !!!
Thank you !!!
Join thousands of data leaders on the AI newsletter. Join over 80,000 subscribers and keep up to date with the latest developments in AI. From research to projects and ideas. If you are building an AI startup, an AI-related product, or a service, we invite you to consider becoming a sponsor.
Published via Towards AI
Related posts


Popular posts

 for 2021")


Updates

Recent Posts


