


Using Deep Learning for Object Detection in Aerial Images
Last Updated on January 6, 2023 by Editorial Team
Last Updated on January 15, 2022 by Editorial Team
Author(s): Nathan Urinovsky
Originally published on Towards AI the World’s Leading AI and Technology News and Media Company. If you are building an AI-related product or service, we invite you to consider becoming an AI sponsor. At Towards AI, we help scale AI and technology startups. Let us help you unleash your technology to the masses.
Deep Learning
Sharing my experience working on my first ever hands-on ML project, and what I learned
Machine Learning, Deep Learning, Data science… We have been hearing these terms for several years now, and they don’t seem to fade away any time soon. I was 14 years old the first time I heard the pair of words “Machine Learning”, back in 2018.
A year later, I implemented a neural network for a basic image classification using TensorFlow and Keras as part of my high school Machine Learning class.
Fast-forward 2 more years of studying Machine Learning theory and hands-on practice, I graduated high school with a major in Software Engineering with a focus on Deep Learning. My final project’s theme is “System for dealing with illegal construction using object detection in aerial images”.
Background
Some civil engineers’ job is to help deal with illegal construction. They do so by taking an aerial image of a certain area and manually marking every building in the image. They repeat this process with an aerial image of the same place that was shot several years later. They then compare the two and find out what has changed (new buildings were added, new floors added to a certain building, etc.), and check the permits of buildings in this area, to determine whether there has been a case of illegal construction. The problem with marking buildings manually is that this process is slow, difficult, and time-consuming. However, if this process was done automatically, it would become fast and easy and would save a lot of time for many engineers, and most importantly, would be a lot of help in the fight against illegal construction.
System architecture
There are several layers to the system:
- The Persistence layer — contains all the data that is stored in the system and is comprised of components:
– The database where business data is stored
– Files storage that stores images for both the Management System and the Detection Server. - The Data Access Layer — code that manipulates data stored in the database.
- The Business layer — this layer consists of the following parts:
– Business Logic — contains the functionality required by the UI and the integration with the Detection Logic component. This integration is implemented using REST APIs.
– Detection Logic — this component is implemented as a WEB Service, serving REST requests. The functionality of this service includes processing of the images, detection of buildings on them, drawing bounding boxes around the buildings, and serving processed images through REST API. - The UI layer — this layer consists of the engineers’ UI, which is a desktop app, and the supervisors’ UI, which is a website. A more comprehensive explanation regarding the UI will come later in the article.
Research
Today, there is a variety of Machine Learning algorithms, utilized for different use cases, so, to pick the right one for my project, I had to do some research.
I considered several algorithms. Among them were SVM and RNN.
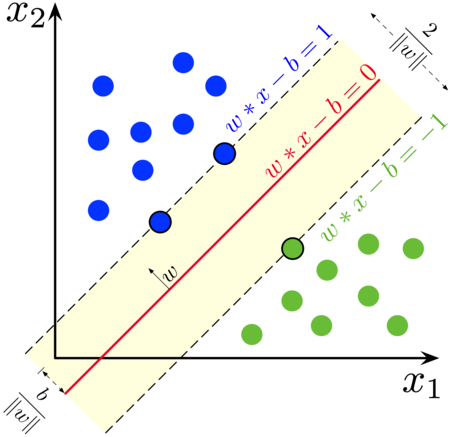
SVM is an algorithm that is used for classification and regression problems, and it solves them by drawing a decision boundary/hyperplane, which means this algorithm is not the one we need for our task, which is object detection in images.
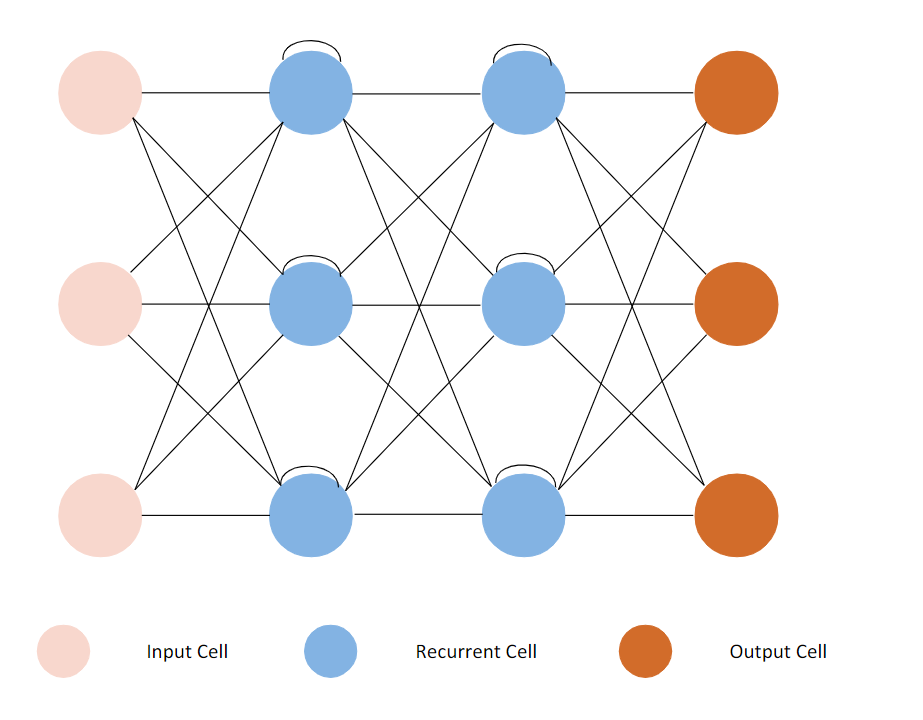
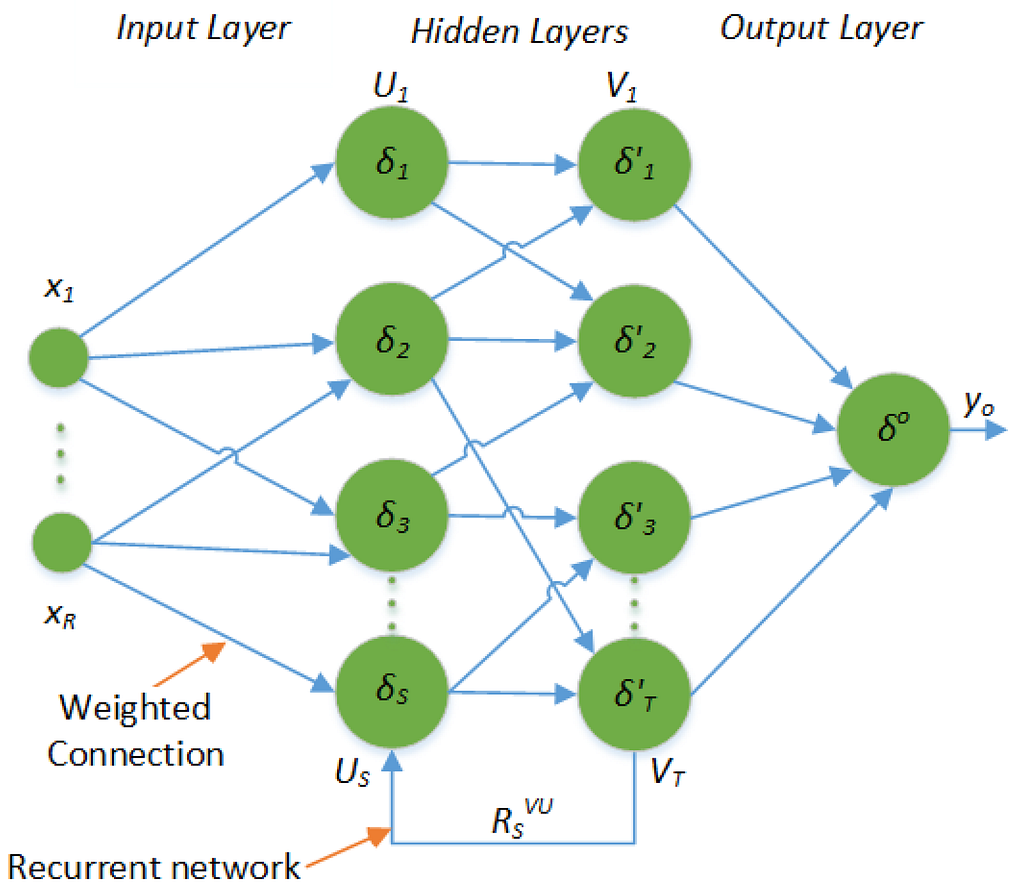
After quickly examining the SVM, I decided to see whether there is a type of neural network that could be of any use. There are many types of neural networks, like the RNN (Recurrent Neural Network), that can use its internal memory to process sequences of inputs in various lengths to solve problems related to time series data, text data, and video data, such as sentiment classification, language translation, connected handwriting recognition, etc. Again, this is not what I need for this project, so RNNs are not very useful.
After reviewing a variety of NNs, I have finally discovered the type of NN that just might be the right one for my project — CNNs.
CNN (Convolutional Neural Network)
A CNN is a type of neural network that uses filters to extract features from images. It is mostly applied to analyze visual imagery.
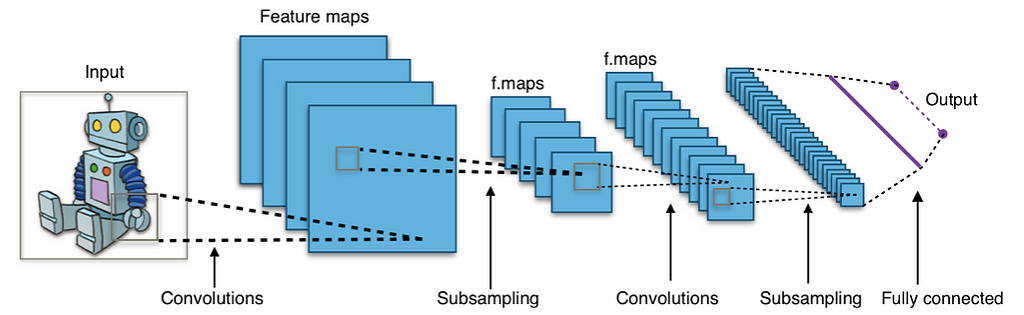
“But what is convolution?” you might ask. A convolution is a mathematical operation applied on a matrix, usually, the image represented in the form of pixels or numbers. During this operation, a dot product is performed between the filter’s (also called “kernel”) values and the image’s values over which the kernel is hovering, until the kernel finishes hovering over each value in the matrix representing the image. The objective of this process is to extract features from the input image.
Another important layer is the pooling layer, which is responsible for reducing the spatial size of a convolved feature, and by that decreases the computational power required to process the data. There are two types of Pooling: Max Pooling and Average Pooling. Max Pooling returns the maximum value from the portion of the image covered by the Kernel. Average Pooling returns the average of all the values from the portion of the image covered by the Kernel.

The Retinanet
During my research, I checked through many CNN architectures, such as the RCNN, Yolo, etc. More information regarding those and others can be found here. I had a limited amount of time to work on this project, and other components of it on which I had to work on besides the ML part, so I had to find a library where an object detection algorithm has already been implemented, which would let me train, predict and draw bounding boxes around detected objects. After extensive research online, I encountered the RetinaNet.
The RetinaNet is a composite network composed of:
- backbone network called Feature Pyramid (FPN) Net built on top of ResNet in a fully convolutional fashion, which is used for computing feature maps of an input image.
- Object classification subnetwork.
- Bounding box regression subnetwork.
The object classification subnetwork and the Bounding box regression subnetwork are built on each FPN level and they use the output from the backbone.
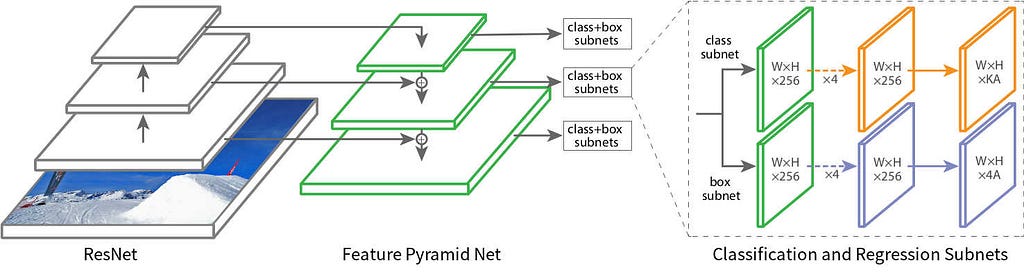
The FPN’s construction is composed of two pathways connected with lateral connections.
The first one is a Bottom-up pathway. In this pathway, the feature maps of the input image are produced. The last feature map produced by each group of consecutive layers that output feature maps of the same scale are later used as the foundation of the feature pyramid.
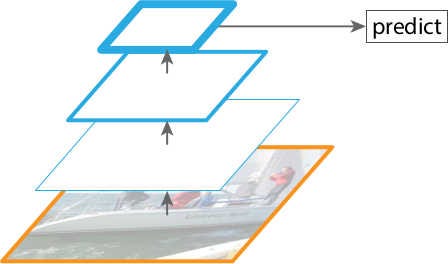
The second one is a Top-down pathway. In this pathway, the last feature map from the bottom-up pathway is expanded to the same scale as the second-to-last feature map. The two are then merged, and the new feature map is then fed to the two subnetworks. This process is iterated until each feature map from the bottom-up pathway has a corresponding new feature map connected with lateral connections.

In my project, I used Keras-retinanet (Keras implementation of RetinaNet) to train, predict and draw bounding boxes around detected buildings in aerial images.
Creating the dataset
After I found the right modules for performing the desired task (in this project, it is object detection in aerial images), I needed data for model training and prediction. On my search for a dataset, I tried finding one with images that contained buildings and metadata XML files storing the buildings’ location in each image (one XML file for each image). Unfortunately, I didn’t find one, but I did find a dataset that might be useful. This dataset is the Swimming Pool And Car Detection dataset, which contains images with cars and pools, and XML files storing the location of pools and cars in these images. You might wonder why I chose this dataset. The reason is simple. In the same pictures where there are cars and pools, there are also buildings, so I can use the dataset’s images for training and predicting.
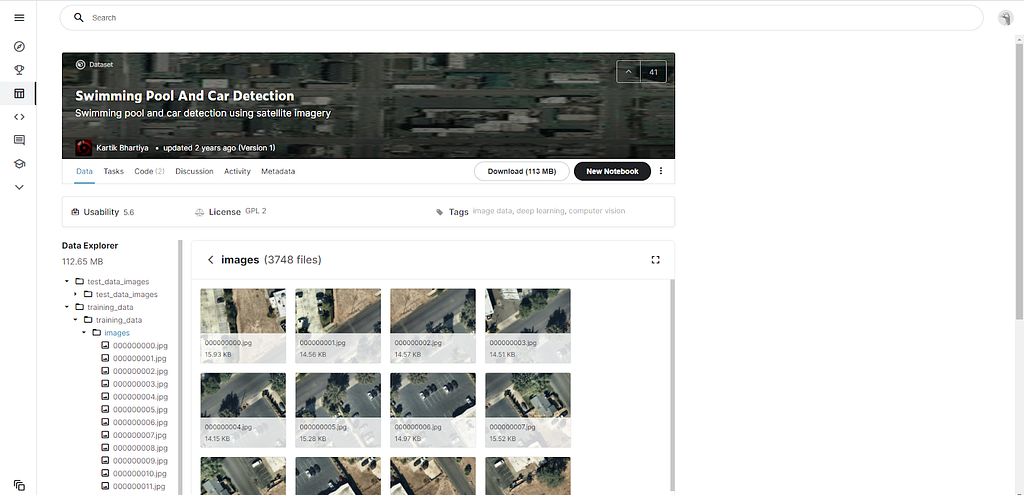
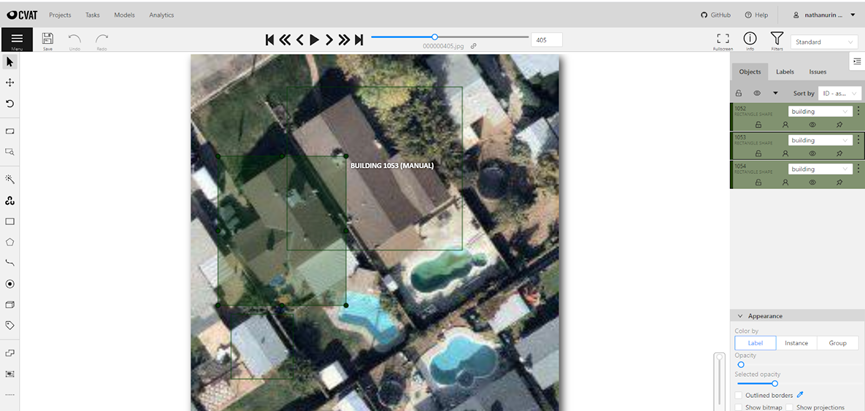
To create XML files storing the objects’ location in the images. I used CVAT, a computer vision annotation tool, that let me draw bounding boxes around objects in images and later generate the XML files I needed for training. Out of about a thousand images I had, I created XML files for 600 images, 224X224 pixels each.
Now that I have all images and their corresponding XML files, I can start training the model.
Training and predicting
Now, all I have left is to train the model and use one of the trained model files generated later in the project. Because the code for training the model was run on Google Colab, I first had to mount my Google Drive. Then, I imported all modules I needed. Afterward, I extracted the annotations from the XML files and stored them in CSV files required for training. The final step is the training itself, and this is a step that I had to repeat several times. The reason for this is that I had to find a certain number of epochs (one round of training of all training data), steps (part of the epoch where a certain amount of the data is fed to the network), that would give me the optimal results.
I decided to try a few times, with a different numbers of epochs, steps, and batch sizes, to see which one gives me better results. The following table summarizes some of my attempts in finding a better combination of these parameters.
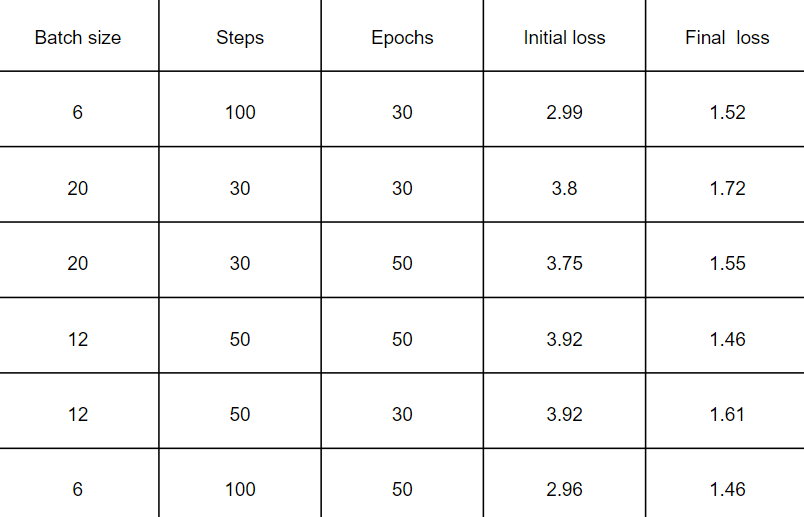
It can be seen from this table that the more epochs and the most steps (=smaller batch size) gave us the better results, as the training attempt with the most epochs and step gave the lowest initial loss (2.96) and lowest final loss (1.46).
Every time an epoch ends, a new trained-model file is generated for us, which can be used for prediction.
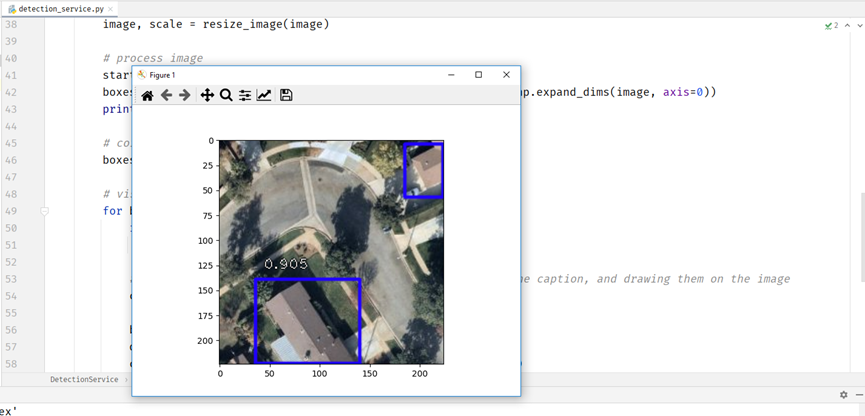
For prediction, I used one of the trained-model files generated before, as well as the prediction modules and bounding boxes modules of keras_retinanet. One thing I had to focus on was the confidence threshold of the model required for drawing a bounding box. I started testing how the model was done using different images, and according to the model’s performance, I changed the confidence threshold, so that it won’t be too low (which might lead to drawing bounding boxes around objects that are not buildings), and not too high (which might lead to not drawing bounding boxes around objects even if they’re buildings).
It works! Our model does a very good job at drawing bounding boxes around the buildings, and with very high confidence (unfortunately for some reason the confidence of the detected building in the upper right corner can’t be seen in the image).
Now all I need is to build the UI, so users can use my project, and find a way to make my python code work in a project that is mostly written in C#.
Bringing my project to life
Being able to perform object detection on aerial images is cool and everything, but what worth does it have if you can’t use it in an easy-to-use UI?
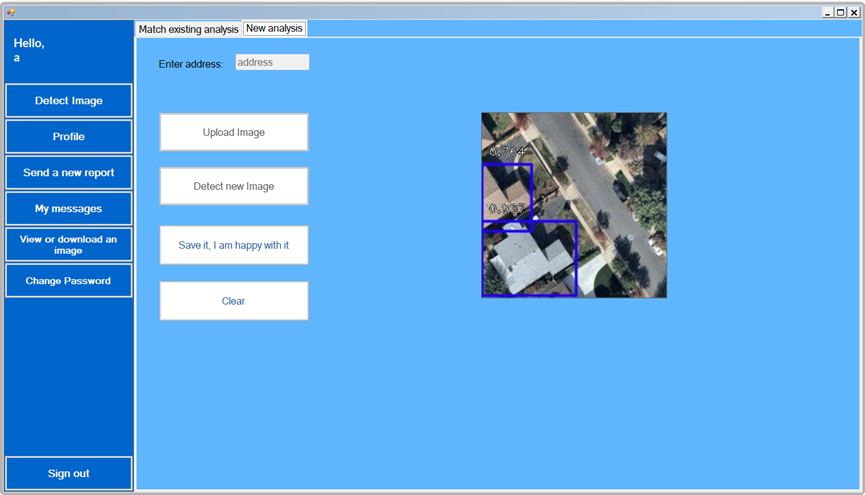
There are two users in this project, which means there are two UI environments. The first type of user is an engineer. The engineer’s UI environment is going to be used mainly for detecting buildings in aerial images in newly added and existing addresses, viewing past detected images, and sending reports to supervisors. The second type of user is a supervisor. The supervisor is responsible for viewing reports sent by engineers, viewing, and adding building permits, and determining that there has been a case of illegal construction.
Luckily, I got windows forms by my side, which lets me build desktop applications, and this is where object detections are going to be used.
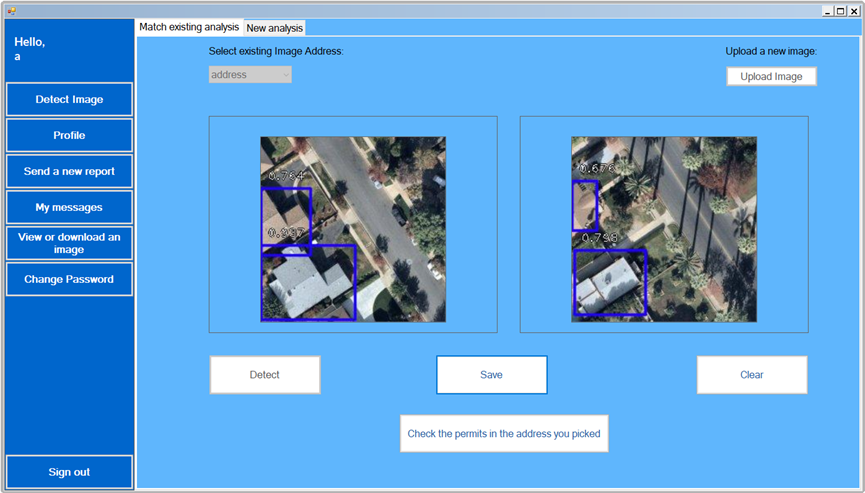
The engineer can either detect buildings in an image that was taken in a newly added address
Or detect buildings in an image that was taken in an address that already exists in the system and compare it to the previous one.
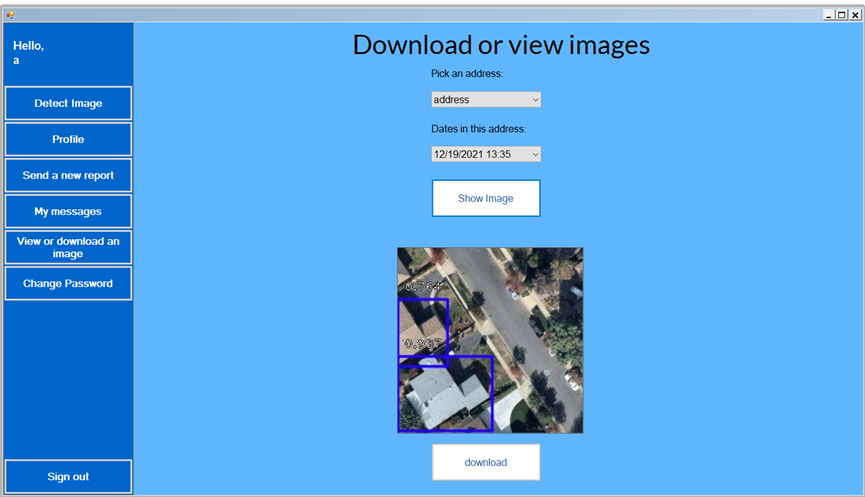
The engineer can also view all images with bounding boxes from different addresses and times.
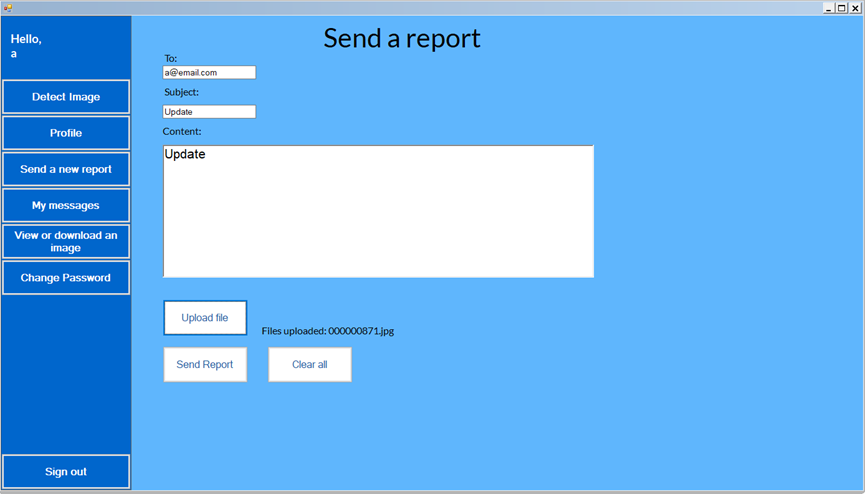
And even send reports to their supervisor.
Speaking of supervisors, they also get their own UI, A website, built using aspx.
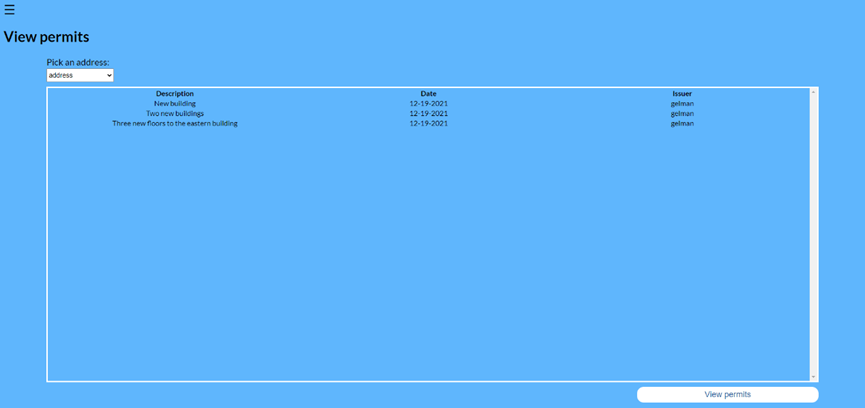
In their UI environment, the supervisors can view all building permits.
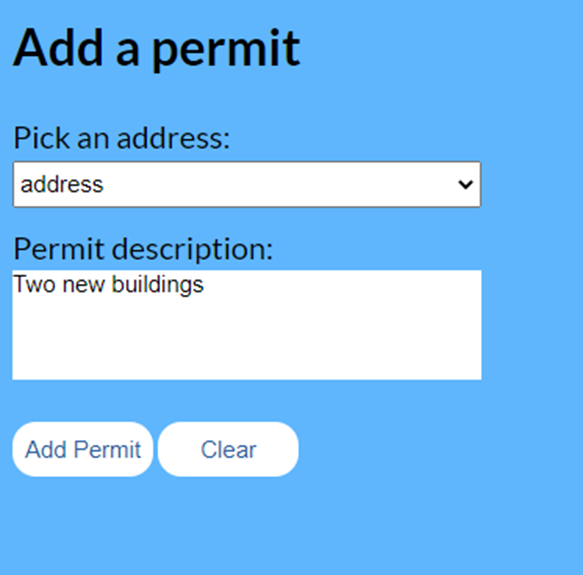
Add a new building permit.
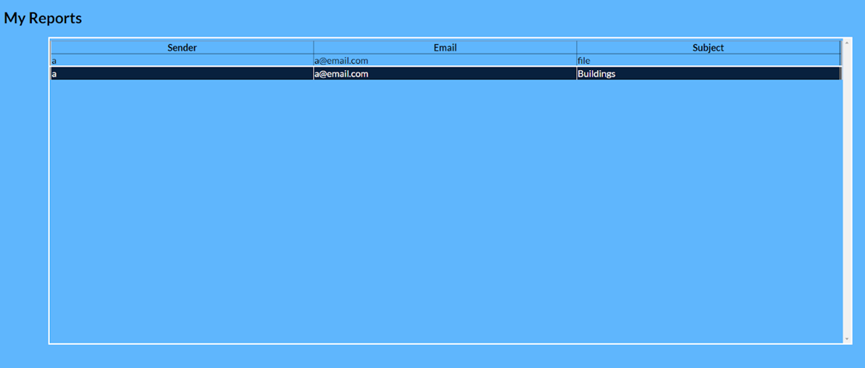
And watch reports sent to them.
I designed both environments with similar shades, simply to give the feeling they are both parts of the same system.
Now that you can see I used python in a mostly C# project, let’s see how I made that happen.
Using python in a mostly C# project
Python code can’t run in C# just like that, some additional steps must be done to make that possible. It is possible to convert the python file into a .EXE file and run it using C# code, but I did something different. I’ve set up a web server with Flask, which handles requests from the management system.
The management system sends a POST request to the server and receives the URL of the resource representing an image containing bounding boxes after detection is done.
The server receives the image, performs detection on it, and returns the URL of the resource representing an image containing bounding boxes to the management system.
The management system then displays the image with bounding boxes instead of the image without bounding boxes, as you have previously seen.
What I learned
Throughout this process, I learned technical things like:
1. Setting up a web server with Flask.
2. Working with databases.
3. CNN architectures.
4. Performing object detection using keras_retinanet.
5. REST API.
But in addition to those, I also learn another lesson, such as:
1. Knowledge gaps should be tackled before anything else.
2. Things can get hard, but this is not a reason to quit.
3. You should ask for help if you need it.
That’s pretty much it! Thank you very much for reading this article. You can also visit my Github page here!
Sources
[1] T. Bandara, Let’s build a simple distributed computing system, for modern cloud (2021), Towards Data Science
[2] R. Ghandi, R-CNN, Fast R-CNN, Faster R-CNN, YOLO — Object Detection Algorithms (2018), Towards Data Science
[3] N. Kumar, Recurrent Neural Networks (RNN) Explained — the ELI5 way (2019), Towards Data Science
[4] T. Lin, P. Dollár, R. Girshick, K. He, B. Hariharan and S. Belongie, Feature Pyramid Networks for Object Detection (2016), arXiv
[5] T. Lin, P. Goyal, R. Girshick, K. He, and P. Dollár, Focal Loss for Dense Object Detection (2017), arXiv
[6] A. Pai, CNN vs. RNN vs. ANN — Analyzing 3 Types of Neural Networks in Deep Learning (2020), Analytics Vidhya
[7] R. Pupale, Support Vector Machines (SVM) — An Overview (2018), Towards Data Science
[8] S. Saha, A Comprehensive Guide to Convolutional Neural Networks — the ELI5 way (2018), Towards Data Science
[9] A. Tch, The mostly complete chart of Neural Networks, explained (2017), Towards Data Science
[10] N. Zeng, RetinaNet Explained and Demystified (2018), blog.zenggyu.com
Using Deep Learning for Object Detection in Aerial Images was originally published in Towards AI on Medium, where people are continuing the conversation by highlighting and responding to this story.
Join thousands of data leaders on the AI newsletter. It’s free, we don’t spam, and we never share your email address. Keep up to date with the latest work in AI. From research to projects and ideas. If you are building an AI startup, an AI-related product, or a service, we invite you to consider becoming a sponsor.
Published via Towards AI
Towards AI Academy
We Build Enterprise-Grade AI. We'll Teach You to Master It Too.
15 engineers. 100,000+ students. Towards AI Academy teaches what actually survives production.
Start free — no commitment:
→ 6-Day Agentic AI Engineering Email Guide — one practical lesson per day
→ Agents Architecture Cheatsheet — 3 years of architecture decisions in 6 pages
Our courses:
→ AI Engineering Certification — 90+ lessons from project selection to deployed product. The most comprehensive practical LLM course out there.
→ Agent Engineering Course — Hands on with production agent architectures, memory, routing, and eval frameworks — built from real enterprise engagements.
→ AI for Work — Understand, evaluate, and apply AI for complex work tasks.
Note: Article content contains the views of the contributing authors and not Towards AI.
Related posts
Recent Posts


")

