Name: Towards AI Legal Name: Towards AI, Inc. Description: Towards AI is the world's leading artificial intelligence (AI) and technology publication. Read by thought-leaders and decision-makers around the world. Phone Number: +1-650-246-9381 Email: pub@towardsai.net
228 Park Avenue South New York, NY 10003 United States
Website: Publisher: https://towardsai.net/#publisher Diversity Policy: https://towardsai.net/about Ethics Policy: https://towardsai.net/about Masthead: https://towardsai.net/about
Name: Towards AI Legal Name: Towards AI, Inc. Description: Towards AI is the world's leading artificial intelligence (AI) and technology publication. Founders: Roberto Iriondo, , Job Title: Co-founder and Advisor Works for: Towards AI, Inc. Follow Roberto: X, LinkedIn, GitHub, Google Scholar, Towards AI Profile, Medium, ML@CMU, FreeCodeCamp, Crunchbase, Bloomberg, Roberto Iriondo, Generative AI Lab, Generative AI Lab Denis Piffaretti, Job Title: Co-founder Works for: Towards AI, Inc. Louie Peters, Job Title: Co-founder Works for: Towards AI, Inc. Louis-François Bouchard, Job Title: Co-founder Works for: Towards AI, Inc. Cover:
Towards AI Cover
Logo:
Towards AI Logo
Areas Served: Worldwide Alternate Name: Towards AI, Inc. Alternate Name: Towards AI Co. Alternate Name: towards ai Alternate Name: towardsai Alternate Name: towards.ai Alternate Name: tai Alternate Name: toward ai Alternate Name: toward.ai Alternate Name: Towards AI, Inc. Alternate Name: towardsai.net Alternate Name: pub.towardsai.net
5 stars – based on 497 reviews

Frequently Used, Contextual References

TODO: Remember to copy unique IDs whenever it needs used. i.e., URL: 304b2e42315e

Resources

Take our 85+ lesson From Beginner to Advanced LLM Developer Certification: From choosing a project to deploying a working product this is the most comprehensive and practical LLM course out there!

Publication

Tips and tricks for Plotly Bar Chart
Latest

Tips and tricks for Plotly Bar Chart

Last Updated on August 6, 2021 by Editorial Team

Author(s): Kashish Rastogi

Data Visualization

Step-by-step guide for Bar Chart and making mind-blowing visualization. Tips and tricks to make your work easy.

Image by: https://www.linkedin.com/in/kashish-rastogi-3a8b4119a

You never knew you needed Plotly! Plotly is like chocolate for visualization you can’t get enough of it. The best library has the best user interaction charts.

Here I am going to talk about different types of Bar charts in Plotly. Data is taken from Kaggle and the whole notebook is available here.

The idea behind making a chart.

How you display data has more power than any charts you use, but the right chart also matters a lot.

Let’s get started!

Data

The idea to make a chart was to display which program; TV Shows or Movies has the highest rating on Netflix.

Data for making chart

First Plot

Plotted a stacked bar chart for comparison between TV Shows and Movies. This chart tells us that Netflix’s audience prefers to watch movies rather than TV Shows. The Highest rating is given to Movies and TV Show having TV-MA tag which tell us that most of the content on Netflix is for the mature audience and not for age 17 years and under.

Code:

fig = px.histogram(df, y='rating', color='type')
Stacked Bar chart — Plotly

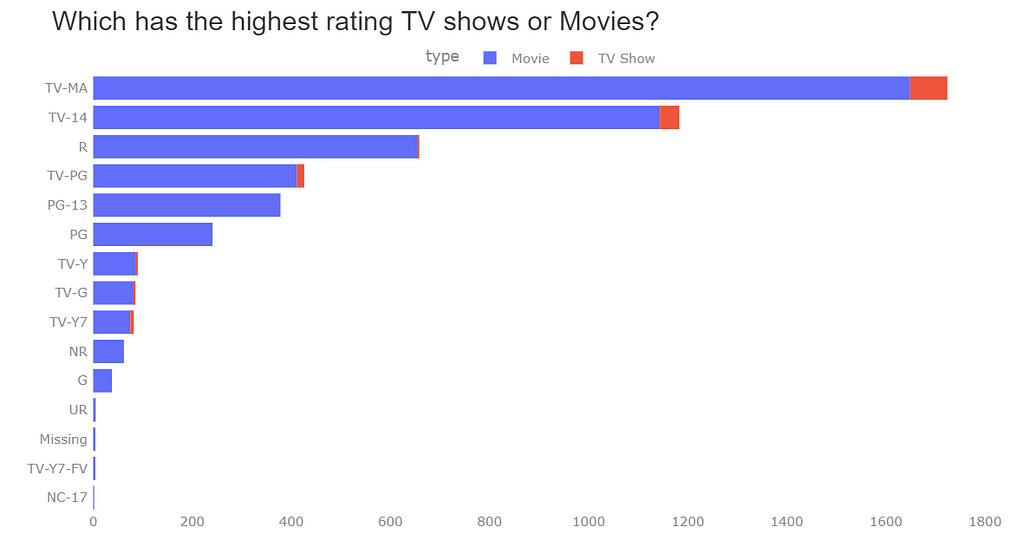
I am quite satisfied with the Stacked bar chart but it is not easy to look for TV shows in the chart. Sometimes the amount of TV Shows is so little that even if the TV Show value is present in the chart at my first glance of the chart I am not being able to see it.

Don’t worry we have another option too.

Group Bar chart

code:

fig = px.histogram(df, y='rating', color='type', barmode='group')
Group Bar chart — Plotly

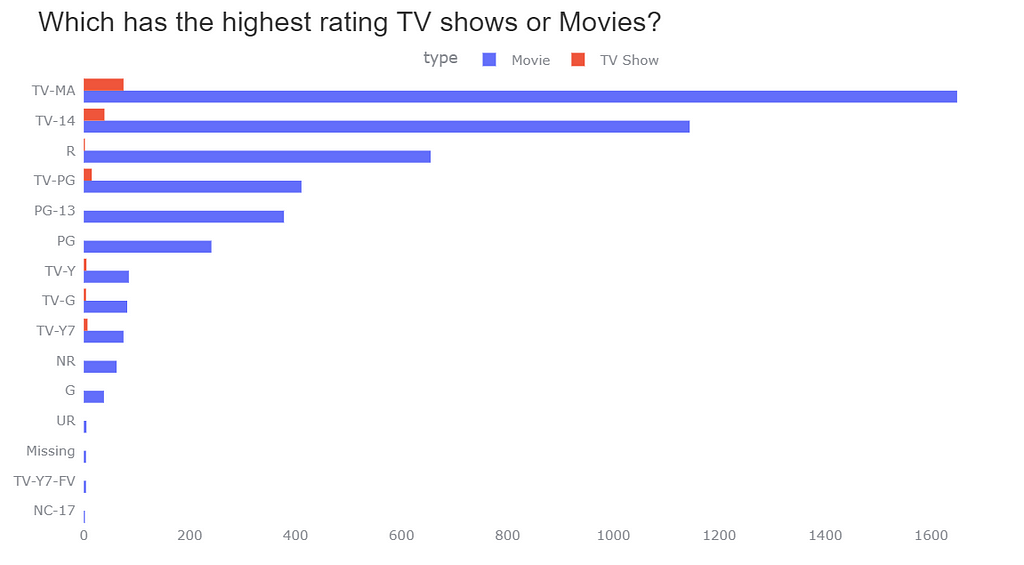
Now I can clearly see and compare the TV Shows and Movies for Ratings. It looks quite elegant now but in TV Show ‘R’ rating have a very small value and, ‘PG-13’, ‘PG’, etc do not have any value. The audience might don’t see this information as its value is very less. Do you think any other chart is more suitable than this? Let’s find out.

Bidirectional Bar chart

Bidirectional Bar Chart — Plotly

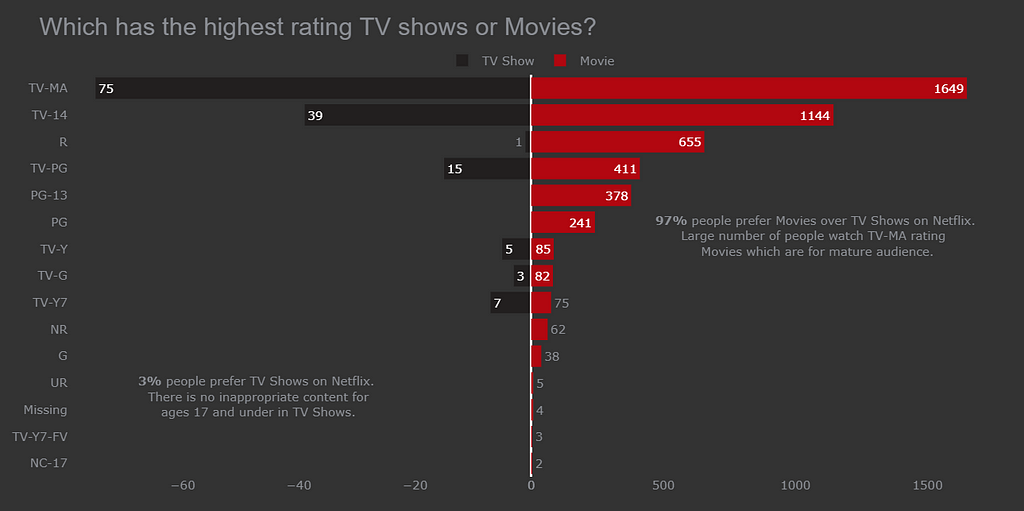
This is the best chart till now it is easy to compare both TV Show and Movies vs Rating.

Code:

# making a copy of df
dff = df.copy()
#1. making a df one for tv show with rating
df_tv_show = dff[dff['type']=='TV Show'][['rating', 'type']].rename(columns={'type':'tv_show'})
# making a df for movie with rating
df_movie = dff[dff['type']=='Movie'][['rating', 'type']].rename(columns={'type':'movie'})

Making a data frame for each TV Show and Movie with Ratings.

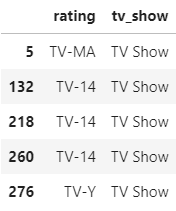
Selecting the data which has Type= TV Show with a rating and renaming the column to ‘tv_show’. The df_tv_show look like this

Data Frame of df_tv_show

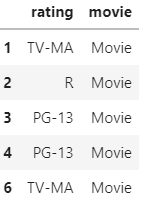
Selecting the data which has Type= Movie with a rating and renaming the column to ‘movie’. The df_movie look like this

Data Frame of df_movie

Now let’s find out the value counts of rating in df_tv_show and df_movie.

# 2.
df_tv_show = df_tv_show.rating.value_counts()
df_tv_show = pd.DataFrame(df_tv_show).reset_index().rename(columns={'index':'tv_show'})
df_tv_show['rating_final'] = df_tv_show['rating']
# making rating column value negative
df_tv_show['rating'] *= -1
df_movie = df_movie.rating.value_counts()
df_movie = pd.DataFrame(df_movie).reset_index().rename(columns={'index':'movie'})

After finding out the value count of the rating rename the columns to tv_show. We want to build a Bidirectional Bar chart so one of the ‘type’ has to set the values of rating on the negative x-axis. Let’s make a new column rating_final where multiply (-1) with the original values of rating.

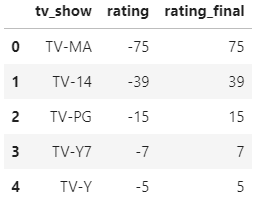
The data look like this for df_tv_show.

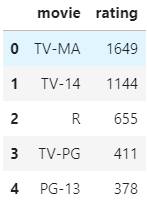
After finding out the value count of the rating rename the columns to the movie. The data look like this for df_movie.

All the preprocessing is done.

Let’s make the Bidirectional Bar Chart

Code:

fig = make_subplots(rows=1, cols=2, specs=[[{}, {}]], shared_yaxes=True, horizontal_spacing=0)
# bar plot for tv shows
fig.append_trace(go.Bar(x=df_tv_show.rating, y=df_tv_show.tv_show,
orientation='h', showlegend=True,
text=df_tv_show.rating_final,
name='TV Show',
marker_color='#221f1f'), 1, 1)
# bar plot for movies
fig.append_trace(go.Bar(x=df_movie.rating, y=df_movie.movie,
orientation='h', showlegend=True,
text=df_movie.rating,
name='Movie', marker_color='#b20710'), 1, 2)

Making 2 subplots of bar chart one bar chart having df_tv_show and another one with df_movie.

Parameters:

  • shared_yaxis= True: To make a bidirectional bar chart; the bar chart needs to share the y-axis
  • horizontal_spacing=0: Space between both the bar charts should be 0. If you want space between the 2 bar charts then specify the value in this parameter.
  • orientation: We can see the bar chart in two forms one is horizontal and another one is the vertical
  • text: The value which we are seeing on the bar is being displayed with ‘text’ parameter.
  • name: It will specify the name of the legends (Movie, TV Show)
  • marker_color: You can specify any color you want for the bars.

For further details in the parameters give a look at this blog.

These are the additional parameters to look the bar chart more attractive.

fig.update_xaxes(showgrid=False)
fig.update_yaxes(showgrid=False, categoryorder='total ascending',
ticksuffix=' ', showline=False)
fig.update_traces(hovertemplate=None)
fig.update_layout(title='Which has the highest rating TV shows or Movies?',
margin=dict(t=80, b=0, l=70, r=40),
hovermode="y unified",
xaxis_title=' ', yaxis_title=" ",
plot_bgcolor='#333', paper_bgcolor='#333',
title_font=dict(size=25, color='#8a8d93',
family="Lato, sans-serif"),
font=dict(color='#8a8d93'),
legend=dict(orientation="h", yanchor="bottom",
y=1, xanchor="center", x=0.5),
hoverlabel=dict(bgcolor="black", font_size=13,
font_family="Lato, sans-serif"))
fig.add_annotation(dict(x=0.81, y=0.6, ax=0, ay=0,
xref = "paper", yref = "paper",
text= "<b>97%</b> people prefer Movies over TV Shows on Netflix.<br> Large number of people watch TV-MA rating <br> Movies which are for mature audience."
))
fig.add_annotation(dict(x=0.2, y=0.2, ax=0, ay=0,
xref = "paper", yref = "paper",
text= "<b>3%</b> people prefer TV Shows on Netflix.<br> There is no inappropriate content for<br> ages 17 and under in TV Shows."
))
# bar plot for movies
fig.append_trace(go.Bar(x=df_movie.rating, y=df_movie.movie, orientation='h', showlegend=True, text=df_movie.rating,
name='Movie', marker_color='#b20710'), 1, 2)
fig.update_xaxes(showgrid=False)
fig.update_yaxes(showgrid=False, categoryorder='total ascending', ticksuffix=' ', showline=False)
fig.update_traces(hovertemplate=None)
fig.update_layout(title='Which has the highest rating TV shows or Movies?',
margin=dict(t=80, b=0, l=70, r=40),
hovermode="y unified",
xaxis_title=' ', yaxis_title=" ",
plot_bgcolor='#333', paper_bgcolor='#333',
title_font=dict(size=25, color='#8a8d93', family="Lato, sans-serif"),
font=dict(color='#8a8d93'),
legend=dict(orientation="h", yanchor="bottom", y=1, xanchor="center", x=0.5),
hoverlabel=dict(bgcolor="black", font_size=13, font_family="Lato, sans-serif"))
fig.add_annotation(dict(x=0.81, y=0.6, ax=0, ay=0,
xref = "paper", yref = "paper",
text= "<b>97%</b> people prefer Movies over TV Shows on Netflix.<br> Large number of people watch TV-MA rating <br> Movies which are for mature audience."
))
fig.add_annotation(dict(x=0.2, y=0.2, ax=0, ay=0,
xref = "paper", yref = "paper",
text= "<b>3%</b> people prefer TV Shows on Netflix.<br> There is no inappropriate content for<br> ages 17 and under in TV Shows."
))

Steps to make this chart:

Changing the color of bars in the chart.

  • Choosing appropriate colors like red and black which are in the Netflix logo. You can choose any color you want but choose contrast color when you have charts that need a comparison like the above chart.

Setting the background color of the chart.

  • Setting the background and bar color should be always different like in this case the bar color for a TV Show is a darker shade of black and the background is a lighter shade of black. We can easily differentiate both the bar and background.

Giving appropriate Title to the chart.

  • Most of the time people use a title that is very basic like ‘Type vs Rating’ this title is not wrong but having a Title that automatically tells you about the chart is a very crucial step.
  • The title which we use here is ‘Which has the highest Rating TV Shows or Movies on Netflix?’ This title automatically tells us that the below chart will be a comparison between TV Show and Movie for Ratings and additionally it also states that the data which we are looking for is from Netflix.

Adding text to the bar

  • When should you add text to the bar it depends on the use case.
  • Let’s take an example like here in the above chart when we compare the TV shows and Movies with Ratings. In TV Show ‘R’ rating does have value and, ‘PG-13’, ‘PG’, etc do not have any value. The audience might don’t see this information as its value is very less that’s why it is important to set the text on the bars.
  • Additionally, it is easy to compare side-by-side bars for TV shows and Movies Vs Ratings.

Adding an annotation to charts

  • Here I have given information like 97% of the audience prefer Movies over TV Show. Laying out more information related to charts is the best way you can present the chart.

Setting different colors for text on the bar, Title, and annotation.

  • You should always follow this Rule:
  • Title: Font for the title should be always bigger
  • Text on Bar: Text on the bar should be always smaller than the main title of the chart.
  • By using this rule the charts you make will look good, So always follow this rule of title, annotation, and text on the bar.

If you find this article useful do like it.

Other Resources:

Bar racing charts with Plotly


Tips and tricks for Plotly Bar Chart was originally published in Towards AI on Medium, where people are continuing the conversation by highlighting and responding to this story.

Published via Towards AI

Feedback ↓

Sign Up for the Course
`; } else { console.error('Element with id="subscribe" not found within the page with class "home".'); } } }); // Remove duplicate text from articles /* Backup: 09/11/24 function removeDuplicateText() { const elements = document.querySelectorAll('h1, h2, h3, h4, h5, strong'); // Select the desired elements const seenTexts = new Set(); // A set to keep track of seen texts const tagCounters = {}; // Object to track instances of each tag elements.forEach(el => { const tagName = el.tagName.toLowerCase(); // Get the tag name (e.g., 'h1', 'h2', etc.) // Initialize a counter for each tag if not already done if (!tagCounters[tagName]) { tagCounters[tagName] = 0; } // Only process the first 10 elements of each tag type if (tagCounters[tagName] >= 2) { return; // Skip if the number of elements exceeds 10 } const text = el.textContent.trim(); // Get the text content const words = text.split(/\s+/); // Split the text into words if (words.length >= 4) { // Ensure at least 4 words const significantPart = words.slice(0, 5).join(' '); // Get first 5 words for matching // Check if the text (not the tag) has been seen before if (seenTexts.has(significantPart)) { // console.log('Duplicate found, removing:', el); // Log duplicate el.remove(); // Remove duplicate element } else { seenTexts.add(significantPart); // Add the text to the set } } tagCounters[tagName]++; // Increment the counter for this tag }); } removeDuplicateText(); */ // Remove duplicate text from articles function removeDuplicateText() { const elements = document.querySelectorAll('h1, h2, h3, h4, h5, strong'); // Select the desired elements const seenTexts = new Set(); // A set to keep track of seen texts const tagCounters = {}; // Object to track instances of each tag // List of classes to be excluded const excludedClasses = ['medium-author', 'post-widget-title']; elements.forEach(el => { // Skip elements with any of the excluded classes if (excludedClasses.some(cls => el.classList.contains(cls))) { return; // Skip this element if it has any of the excluded classes } const tagName = el.tagName.toLowerCase(); // Get the tag name (e.g., 'h1', 'h2', etc.) // Initialize a counter for each tag if not already done if (!tagCounters[tagName]) { tagCounters[tagName] = 0; } // Only process the first 10 elements of each tag type if (tagCounters[tagName] >= 10) { return; // Skip if the number of elements exceeds 10 } const text = el.textContent.trim(); // Get the text content const words = text.split(/\s+/); // Split the text into words if (words.length >= 4) { // Ensure at least 4 words const significantPart = words.slice(0, 5).join(' '); // Get first 5 words for matching // Check if the text (not the tag) has been seen before if (seenTexts.has(significantPart)) { // console.log('Duplicate found, removing:', el); // Log duplicate el.remove(); // Remove duplicate element } else { seenTexts.add(significantPart); // Add the text to the set } } tagCounters[tagName]++; // Increment the counter for this tag }); } removeDuplicateText(); //Remove unnecessary text in blog excerpts document.querySelectorAll('.blog p').forEach(function(paragraph) { // Replace the unwanted text pattern for each paragraph paragraph.innerHTML = paragraph.innerHTML .replace(/Author\(s\): [\w\s]+ Originally published on Towards AI\.?/g, '') // Removes 'Author(s): XYZ Originally published on Towards AI' .replace(/This member-only story is on us\. Upgrade to access all of Medium\./g, ''); // Removes 'This member-only story...' }); //Load ionic icons and cache them if ('localStorage' in window && window['localStorage'] !== null) { const cssLink = 'https://code.ionicframework.com/ionicons/2.0.1/css/ionicons.min.css'; const storedCss = localStorage.getItem('ionicons'); if (storedCss) { loadCSS(storedCss); } else { fetch(cssLink).then(response => response.text()).then(css => { localStorage.setItem('ionicons', css); loadCSS(css); }); } } function loadCSS(css) { const style = document.createElement('style'); style.innerHTML = css; document.head.appendChild(style); } //Remove elements from imported content automatically function removeStrongFromHeadings() { const elements = document.querySelectorAll('h1, h2, h3, h4, h5, h6, span'); elements.forEach(el => { const strongTags = el.querySelectorAll('strong'); strongTags.forEach(strongTag => { while (strongTag.firstChild) { strongTag.parentNode.insertBefore(strongTag.firstChild, strongTag); } strongTag.remove(); }); }); } removeStrongFromHeadings(); "use strict"; window.onload = () => { /* //This is an object for each category of subjects and in that there are kewords and link to the keywods let keywordsAndLinks = { //you can add more categories and define their keywords and add a link ds: { keywords: [ //you can add more keywords here they are detected and replaced with achor tag automatically 'data science', 'Data science', 'Data Science', 'data Science', 'DATA SCIENCE', ], //we will replace the linktext with the keyword later on in the code //you can easily change links for each category here //(include class="ml-link" and linktext) link: 'linktext', }, ml: { keywords: [ //Add more keywords 'machine learning', 'Machine learning', 'Machine Learning', 'machine Learning', 'MACHINE LEARNING', ], //Change your article link (include class="ml-link" and linktext) link: 'linktext', }, ai: { keywords: [ 'artificial intelligence', 'Artificial intelligence', 'Artificial Intelligence', 'artificial Intelligence', 'ARTIFICIAL INTELLIGENCE', ], //Change your article link (include class="ml-link" and linktext) link: 'linktext', }, nl: { keywords: [ 'NLP', 'nlp', 'natural language processing', 'Natural Language Processing', 'NATURAL LANGUAGE PROCESSING', ], //Change your article link (include class="ml-link" and linktext) link: 'linktext', }, des: { keywords: [ 'data engineering services', 'Data Engineering Services', 'DATA ENGINEERING SERVICES', ], //Change your article link (include class="ml-link" and linktext) link: 'linktext', }, td: { keywords: [ 'training data', 'Training Data', 'training Data', 'TRAINING DATA', ], //Change your article link (include class="ml-link" and linktext) link: 'linktext', }, ias: { keywords: [ 'image annotation services', 'Image annotation services', 'image Annotation services', 'image annotation Services', 'Image Annotation Services', 'IMAGE ANNOTATION SERVICES', ], //Change your article link (include class="ml-link" and linktext) link: 'linktext', }, l: { keywords: [ 'labeling', 'labelling', ], //Change your article link (include class="ml-link" and linktext) link: 'linktext', }, pbp: { keywords: [ 'previous blog posts', 'previous blog post', 'latest', ], //Change your article link (include class="ml-link" and linktext) link: 'linktext', }, mlc: { keywords: [ 'machine learning course', 'machine learning class', ], //Change your article link (include class="ml-link" and linktext) link: 'linktext', }, }; //Articles to skip let articleIdsToSkip = ['post-2651', 'post-3414', 'post-3540']; //keyword with its related achortag is recieved here along with article id function searchAndReplace(keyword, anchorTag, articleId) { //selects the h3 h4 and p tags that are inside of the article let content = document.querySelector(`#${articleId} .entry-content`); //replaces the "linktext" in achor tag with the keyword that will be searched and replaced let newLink = anchorTag.replace('linktext', keyword); //regular expression to search keyword var re = new RegExp('(' + keyword + ')', 'g'); //this replaces the keywords in h3 h4 and p tags content with achor tag content.innerHTML = content.innerHTML.replace(re, newLink); } function articleFilter(keyword, anchorTag) { //gets all the articles var articles = document.querySelectorAll('article'); //if its zero or less then there are no articles if (articles.length > 0) { for (let x = 0; x < articles.length; x++) { //articles to skip is an array in which there are ids of articles which should not get effected //if the current article's id is also in that array then do not call search and replace with its data if (!articleIdsToSkip.includes(articles[x].id)) { //search and replace is called on articles which should get effected searchAndReplace(keyword, anchorTag, articles[x].id, key); } else { console.log( `Cannot replace the keywords in article with id ${articles[x].id}` ); } } } else { console.log('No articles found.'); } } let key; //not part of script, added for (key in keywordsAndLinks) { //key is the object in keywords and links object i.e ds, ml, ai for (let i = 0; i < keywordsAndLinks[key].keywords.length; i++) { //keywordsAndLinks[key].keywords is the array of keywords for key (ds, ml, ai) //keywordsAndLinks[key].keywords[i] is the keyword and keywordsAndLinks[key].link is the link //keyword and link is sent to searchreplace where it is then replaced using regular expression and replace function articleFilter( keywordsAndLinks[key].keywords[i], keywordsAndLinks[key].link ); } } function cleanLinks() { // (making smal functions is for DRY) this function gets the links and only keeps the first 2 and from the rest removes the anchor tag and replaces it with its text function removeLinks(links) { if (links.length > 1) { for (let i = 2; i < links.length; i++) { links[i].outerHTML = links[i].textContent; } } } //arrays which will contain all the achor tags found with the class (ds-link, ml-link, ailink) in each article inserted using search and replace let dslinks; let mllinks; let ailinks; let nllinks; let deslinks; let tdlinks; let iaslinks; let llinks; let pbplinks; let mlclinks; const content = document.querySelectorAll('article'); //all articles content.forEach((c) => { //to skip the articles with specific ids if (!articleIdsToSkip.includes(c.id)) { //getting all the anchor tags in each article one by one dslinks = document.querySelectorAll(`#${c.id} .entry-content a.ds-link`); mllinks = document.querySelectorAll(`#${c.id} .entry-content a.ml-link`); ailinks = document.querySelectorAll(`#${c.id} .entry-content a.ai-link`); nllinks = document.querySelectorAll(`#${c.id} .entry-content a.ntrl-link`); deslinks = document.querySelectorAll(`#${c.id} .entry-content a.des-link`); tdlinks = document.querySelectorAll(`#${c.id} .entry-content a.td-link`); iaslinks = document.querySelectorAll(`#${c.id} .entry-content a.ias-link`); mlclinks = document.querySelectorAll(`#${c.id} .entry-content a.mlc-link`); llinks = document.querySelectorAll(`#${c.id} .entry-content a.l-link`); pbplinks = document.querySelectorAll(`#${c.id} .entry-content a.pbp-link`); //sending the anchor tags list of each article one by one to remove extra anchor tags removeLinks(dslinks); removeLinks(mllinks); removeLinks(ailinks); removeLinks(nllinks); removeLinks(deslinks); removeLinks(tdlinks); removeLinks(iaslinks); removeLinks(mlclinks); removeLinks(llinks); removeLinks(pbplinks); } }); } //To remove extra achor tags of each category (ds, ml, ai) and only have 2 of each category per article cleanLinks(); */ //Recommended Articles var ctaLinks = [ /* ' ' + '

Subscribe to our AI newsletter!

' + */ '

Take our 85+ lesson From Beginner to Advanced LLM Developer Certification: From choosing a project to deploying a working product this is the most comprehensive and practical LLM course out there!

'+ '

Towards AI has published Building LLMs for Production—our 470+ page guide to mastering LLMs with practical projects and expert insights!

' + '
' + '' + '' + '

Note: Content contains the views of the contributing authors and not Towards AI.
Disclosure: This website may contain sponsored content and affiliate links.

' + 'Discover Your Dream AI Career at Towards AI Jobs' + '

Towards AI has built a jobs board tailored specifically to Machine Learning and Data Science Jobs and Skills. Our software searches for live AI jobs each hour, labels and categorises them and makes them easily searchable. Explore over 10,000 live jobs today with Towards AI Jobs!

' + '
' + '

🔥 Recommended Articles 🔥

' + 'Why Become an LLM Developer? Launching Towards AI’s New One-Stop Conversion Course'+ 'Testing Launchpad.sh: A Container-based GPU Cloud for Inference and Fine-tuning'+ 'The Top 13 AI-Powered CRM Platforms
' + 'Top 11 AI Call Center Software for 2024
' + 'Learn Prompting 101—Prompt Engineering Course
' + 'Explore Leading Cloud Providers for GPU-Powered LLM Training
' + 'Best AI Communities for Artificial Intelligence Enthusiasts
' + 'Best Workstations for Deep Learning
' + 'Best Laptops for Deep Learning
' + 'Best Machine Learning Books
' + 'Machine Learning Algorithms
' + 'Neural Networks Tutorial
' + 'Best Public Datasets for Machine Learning
' + 'Neural Network Types
' + 'NLP Tutorial
' + 'Best Data Science Books
' + 'Monte Carlo Simulation Tutorial
' + 'Recommender System Tutorial
' + 'Linear Algebra for Deep Learning Tutorial
' + 'Google Colab Introduction
' + 'Decision Trees in Machine Learning
' + 'Principal Component Analysis (PCA) Tutorial
' + 'Linear Regression from Zero to Hero
'+ '

', /* + '

Join thousands of data leaders on the AI newsletter. It’s free, we don’t spam, and we never share your email address. Keep up to date with the latest work in AI. From research to projects and ideas. If you are building an AI startup, an AI-related product, or a service, we invite you to consider becoming a sponsor.

',*/ ]; var replaceText = { '': '', '': '', '
': '
' + ctaLinks + '
', }; Object.keys(replaceText).forEach((txtorig) => { //txtorig is the key in replacetext object const txtnew = replaceText[txtorig]; //txtnew is the value of the key in replacetext object let entryFooter = document.querySelector('article .entry-footer'); if (document.querySelectorAll('.single-post').length > 0) { //console.log('Article found.'); const text = entryFooter.innerHTML; entryFooter.innerHTML = text.replace(txtorig, txtnew); } else { // console.log('Article not found.'); //removing comment 09/04/24 } }); var css = document.createElement('style'); css.type = 'text/css'; css.innerHTML = '.post-tags { display:none !important } .article-cta a { font-size: 18px; }'; document.body.appendChild(css); //Extra //This function adds some accessibility needs to the site. function addAlly() { // In this function JQuery is replaced with vanilla javascript functions const imgCont = document.querySelector('.uw-imgcont'); imgCont.setAttribute('aria-label', 'AI news, latest developments'); imgCont.title = 'AI news, latest developments'; imgCont.rel = 'noopener'; document.querySelector('.page-mobile-menu-logo a').title = 'Towards AI Home'; document.querySelector('a.social-link').rel = 'noopener'; document.querySelector('a.uw-text').rel = 'noopener'; document.querySelector('a.uw-w-branding').rel = 'noopener'; document.querySelector('.blog h2.heading').innerHTML = 'Publication'; const popupSearch = document.querySelector$('a.btn-open-popup-search'); popupSearch.setAttribute('role', 'button'); popupSearch.title = 'Search'; const searchClose = document.querySelector('a.popup-search-close'); searchClose.setAttribute('role', 'button'); searchClose.title = 'Close search page'; // document // .querySelector('a.btn-open-popup-search') // .setAttribute( // 'href', // 'https://medium.com/towards-artificial-intelligence/search' // ); } // Add external attributes to 302 sticky and editorial links function extLink() { // Sticky 302 links, this fuction opens the link we send to Medium on a new tab and adds a "noopener" rel to them var stickyLinks = document.querySelectorAll('.grid-item.sticky a'); for (var i = 0; i < stickyLinks.length; i++) { /* stickyLinks[i].setAttribute('target', '_blank'); stickyLinks[i].setAttribute('rel', 'noopener'); */ } // Editorial 302 links, same here var editLinks = document.querySelectorAll( '.grid-item.category-editorial a' ); for (var i = 0; i < editLinks.length; i++) { editLinks[i].setAttribute('target', '_blank'); editLinks[i].setAttribute('rel', 'noopener'); } } // Add current year to copyright notices document.getElementById( 'js-current-year' ).textContent = new Date().getFullYear(); // Call functions after page load extLink(); //addAlly(); setTimeout(function() { //addAlly(); //ideally we should only need to run it once ↑ }, 5000); }; function closeCookieDialog (){ document.getElementById("cookie-consent").style.display = "none"; return false; } setTimeout ( function () { closeCookieDialog(); }, 15000); console.log(`%c 🚀🚀🚀 ███ █████ ███████ █████████ ███████████ █████████████ ███████████████ ███████ ███████ ███████ ┌───────────────────────────────────────────────────────────────────┐ │ │ │ Towards AI is looking for contributors! │ │ Join us in creating awesome AI content. │ │ Let's build the future of AI together → │ │ https://towardsai.net/contribute │ │ │ └───────────────────────────────────────────────────────────────────┘ `, `background: ; color: #00adff; font-size: large`); //Remove latest category across site document.querySelectorAll('a[rel="category tag"]').forEach(function(el) { if (el.textContent.trim() === 'Latest') { // Remove the two consecutive spaces (  ) if (el.nextSibling && el.nextSibling.nodeValue.includes('\u00A0\u00A0')) { el.nextSibling.nodeValue = ''; // Remove the spaces } el.style.display = 'none'; // Hide the element } }); // Add cross-domain measurement, anonymize IPs 'use strict'; //var ga = gtag; ga('config', 'G-9D3HKKFV1Q', 'auto', { /*'allowLinker': true,*/ 'anonymize_ip': true/*, 'linker': { 'domains': [ 'medium.com/towards-artificial-intelligence', 'datasets.towardsai.net', 'rss.towardsai.net', 'feed.towardsai.net', 'contribute.towardsai.net', 'members.towardsai.net', 'pub.towardsai.net', 'news.towardsai.net' ] } */ }); ga('send', 'pageview'); -->