


Statistics for Machine Learning A-Z
Last Updated on January 6, 2023 by Editorial Team
Last Updated on June 12, 2022 by Editorial Team
Author(s): Gencay I.
Originally published on Towards AI the World’s Leading AI and Technology News and Media Company. If you are building an AI-related product or service, we invite you to consider becoming an AI sponsor. At Towards AI, we help scale AI and technology startups. Let us help you unleash your technology to the masses.
Briefly Explained
Contents
· Introduction
· Terms
  ∘ Numerical Variable
  ∘ Categorical Variable
  ∘ Continuous Variable
  ∘ Discrete Variables
  ∘ Dependent Variable:
  ∘ Independent Variable
  ∘ Observational Studies
  ∘ Experimental Studies
  ∘ Simple Random Sample
  ∘ Stratified Sample
  ∘ Placebo Effect
  ∘ Generalizability
  ∘ Histogram
  ∘ Dot plot
  ∘ Boxplot
  ∘ IQR
  ∘ Q3
  ∘ Q1
  ∘ Left skewed
  ∘ Right skewed
  ∘ Symmetric
  ∘ Mean
  ∘ Median
  ∘ Average
  ∘ Variance
  ∘ Standard deviation
  ∘ Mode
  ∘ Null Hypothesis
  ∘ Alternative Hypothesis
  ∘ P-Value
  ∘ Law of Large Numbers
  ∘ Mutually Exclusive ( Disjoint)
  ∘ Non-disjoint
  ∘ Probability Trees
  ∘ Normal Distribution
  ∘ Binomial Distribution
  ∘ Bernoulli Distribution
  ∘ PDF (Probability Density Function)
  ∘ Z Score
  ∘ Percentiles
  ∘ Sampling Variability
  ∘ Central Limit Theorem
  ∘ Confidence Interval
  ∘ Significance Level
  ∘ Power
  ∘ Accuracy
  ∘ Precision
  ∘ Statistical Inference
  ∘ Type 1 Error
  ∘ Type 2 Error
  ∘ T Distribution
  ∘ Degrees of Freedom
· Conclusion
Introduction
Programming, Statistics, Calculus.
These are 3 things that you should be familiar with if you would like to be involved in Machine Learning.
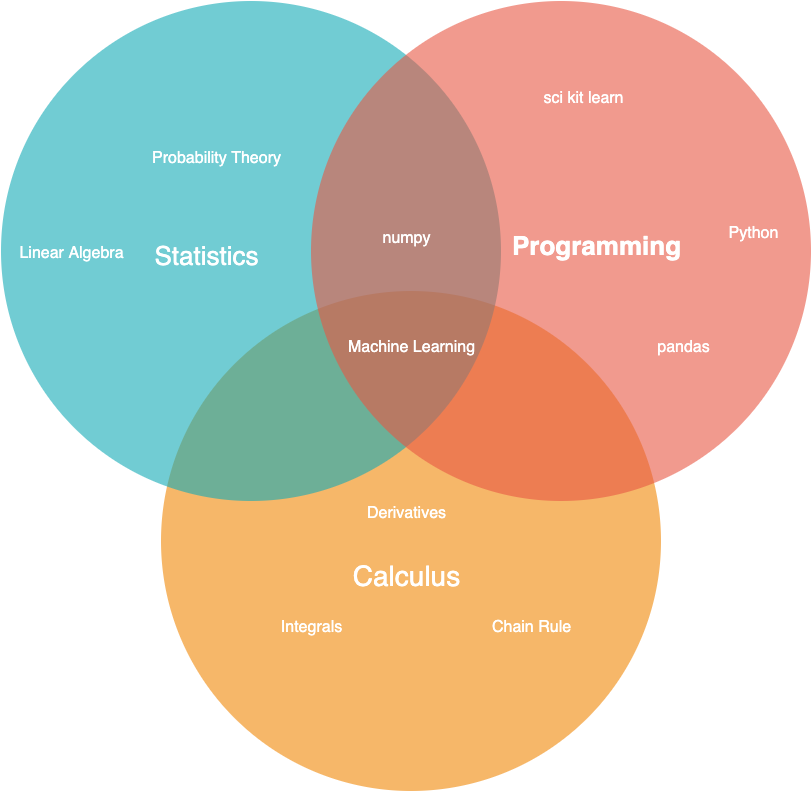
Image By Author
While there are too many courses that existed in the market, I love creating that kind of article to remind myself of these terms.
That helps me refresh my memories and make repetition.
Repetition is the mother of learning, the father of action, which makes it the architect of accomplishment.” Zig Ziglar
Whether you are at the beginning of your Data Science or Machine Learning career or experienced one, that article will serve you to create a neural path in your mind about Statistics.
Let’s dive into these terms from beginning to intermediate.
Terms
Numerical Variable
The value that contains an integer.
Categorical Variable
Contains categories instead of numbers, such as human body shapes such as; skinny, fat, or muscular.
Continuous Variable
1, 2, 3,4, 5,6, 7 … Take a number of values in a given range.
Discrete Variables
1, 5, 8, 11, 35 . The specific set of values.
Dependent Variable:
The two variables, when one changes if the other will change will be dependent variables.
Independent Variable
If others won't change, independent.
Observational Studies
The methods won't be specified by researchers. For example, when they asked you about the method of losing weight, they do not offer you the method such as diet or sport, you could say whatever you like.
Experimental Studies
Now there are limited options, choose one, diet or sport.
Simple Random Sample
You could choose anything.
Stratified Sample
Split populations into the clusters, then randomly sample from each cluster.
Placebo Effect
You will use fake care.
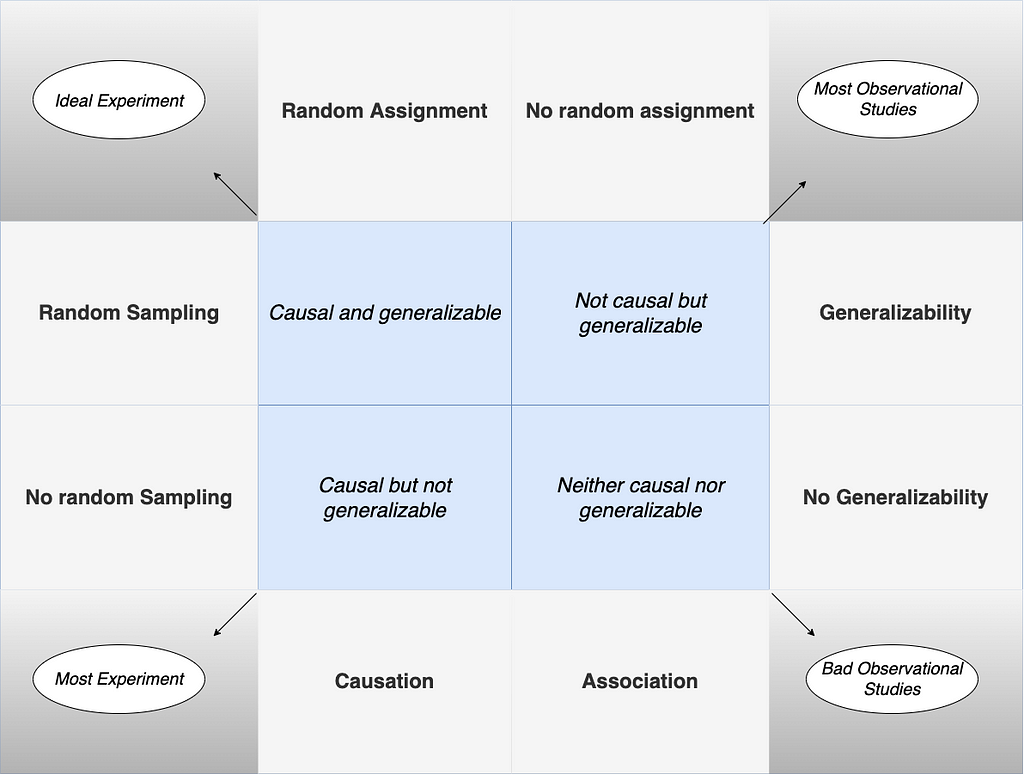
Generalizability
Could we draw a conclusion as a result of our data on the population?
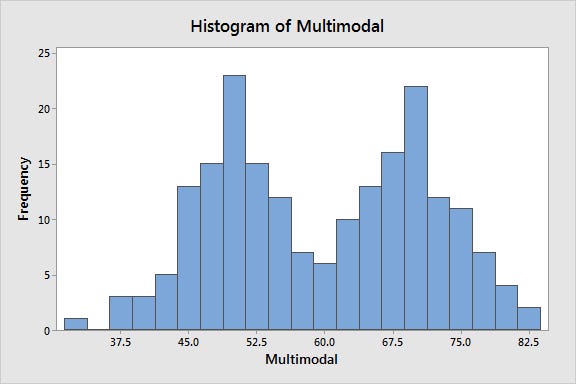
Histogram
It provides a useful view of data density.
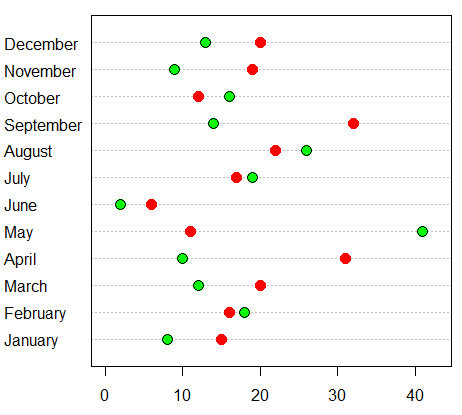
Dot plot
If your sample size is small and you want to view individual data points.
Boxplot
It is good to see statistical values such as IQR and median.
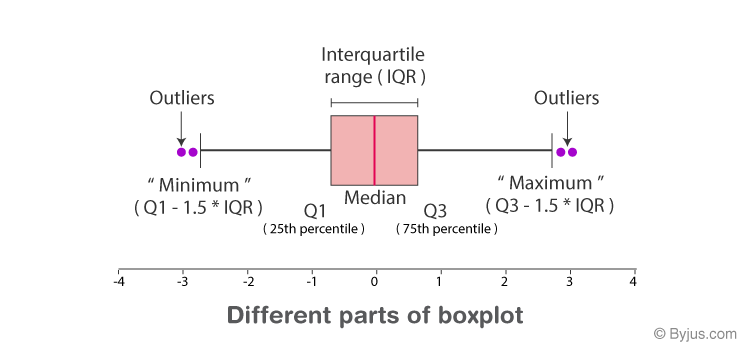
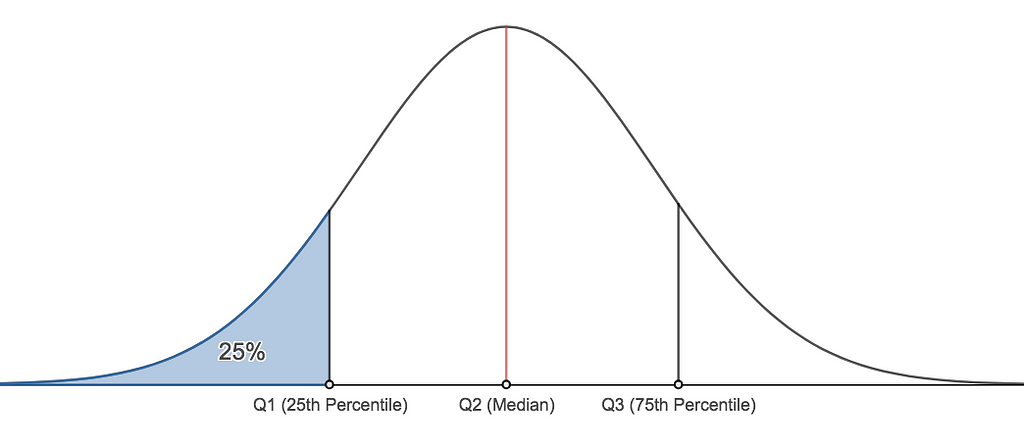
IQR
Interquartile range,Range of thee middle 50 %, Q3-Q1.
Q3
75th percentile.
Q1
25th percentile.
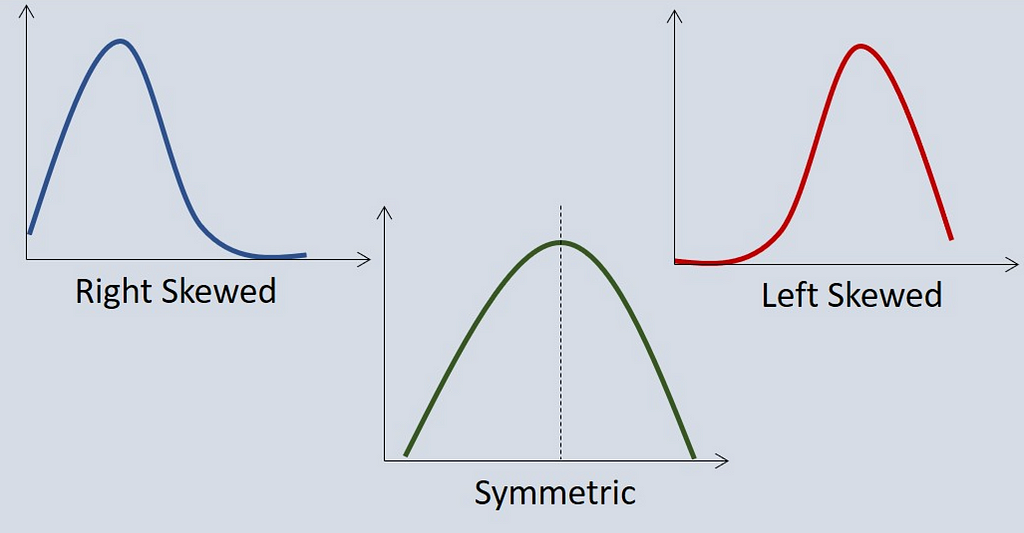
Left skewed
The tail will be on the right side and the density, mean< median.
Right skewed
The tail will be on the right, mean > median.
Symmetric
The mean and median are close together.
Mean
Arithmetic average.
Median
is the number that exists in the middle.
1,5,7 , median : 5
Average
Sum and divide by the number of integers,
a+b/2, a+b+c/3
Variance
The average squared deviation of the mean.
n: number of sample
Variance = (Number1-mean)**2 + (number2 -mean) ** 2 …. + (number n-mean) **2 / (n-1)
Standard deviation
The square root of the variance.
Standard deviation : (Variance) ** 1/2
Mode
Most frequent number.
1,4,4, 7 , mode : 4
Null Hypothesis
Nothing going on, everything should be the same.
Alternative Hypothesis
Something going on, something should be changed.
P-Value
The possibility of your null hypothesis is true.
If the p-value < 0.05, you would reject the null hypothesis, and accept the alternative:
If the p-value >0.05, you would reject the alternative hypothesis.
Law of Large Numbers
As the sample size increases, the mean would be closer to the population means.
Mutually Exclusive ( Disjoint)
Cases that can not happen at identical times.

Non-disjoint
Cases that could happen at an identical time.

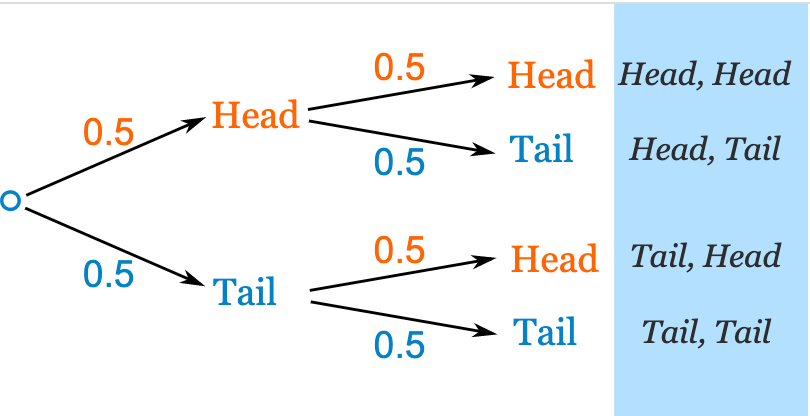
Probability Trees
The trees of continuous possibilities.
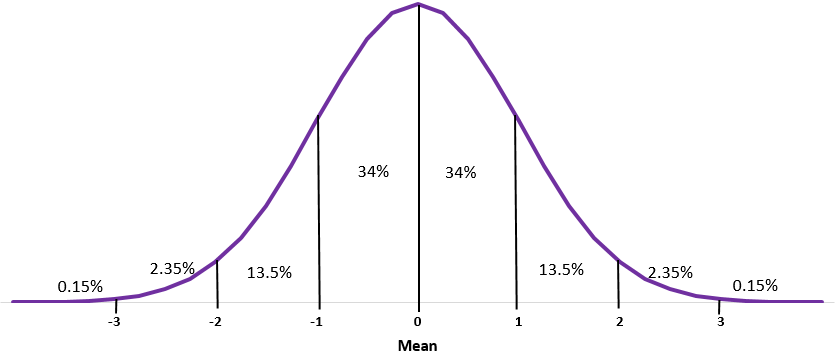
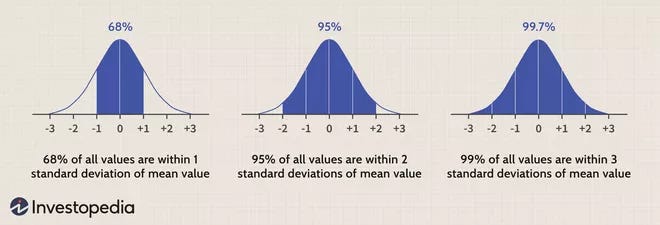
Normal Distribution
It is a probability distribution, that shape is symmetric around the mean.
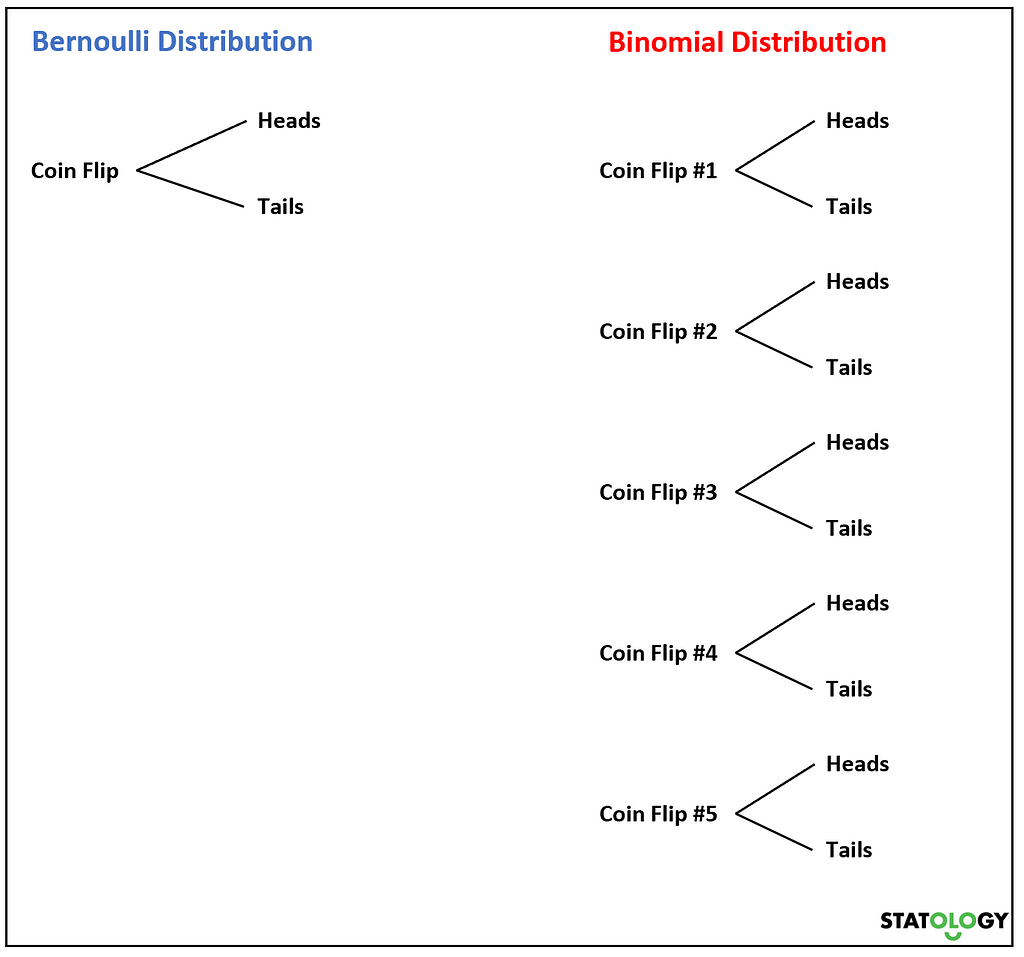
Binomial Distribution
Probability of success or failure ( 2 possible outcomes, like heads or tail. )
Bernoulli Distribution
It is a discrete distribution, and we have still 2 possible outcomes, 0 or 1.
PDF (Probability Density Function)
The function provides the possibility of the value of a random variable will be in the predefined range.
Z Score
(observation-mean) / SD
Z score of the mean is zero.
Percentiles
Sometimes images are stronger than words for describing.
Sampling Variability
It is impossible to gather data from the whole population, we will gather information from different samples and sampling them together via this.
Central Limit Theorem
Describes shapes centers and spreads of sampling distributions when certain conditions are matched. (nearly normal population)(center-mean)(spread-SE)
Confidence Interval
A reasonable range of values for the population parameter is called a confidence interval.
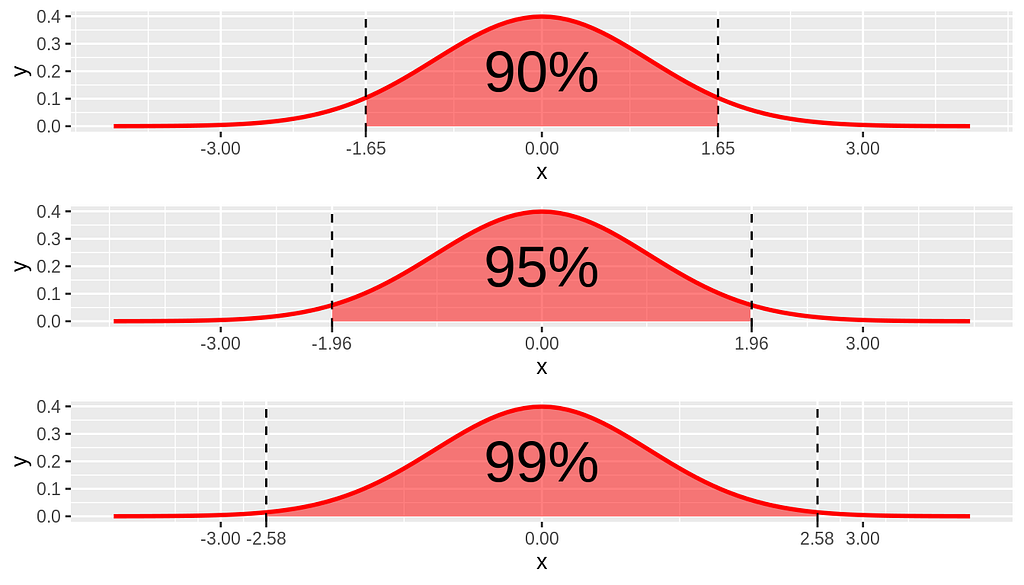
%90 confident of the “ Estimate ±1.65∗SE(Estimate)”
%95 confident that the “ Estimate ±1.96∗SE(Estimate) = (x−1.96σ/√n, x+1.96σ/√n)
% 99 confident that the “ “Estimate ±2.58∗SE(Estimate)”
Significance Level
The probability of rejecting Ho when you shouldn't do.
Power
the likelihood of rejecting the null hypothesis when it should be rejected.
Accuracy
How close is your estimation to the true value?
Precision
It is a quality measurement, how close will your two measurements be to each other.
Statistical Inference
Finding a conclusion from your data by using statistics.
Type 1 Error
It occurs when rejecting a null hypothesis but it should not have to be rejected.
Type 2 Error
It occurs when the null hypotheses should be rejected but you don't.
T Distribution
Comparing means while standard deviation is unknown.
Degrees of Freedom
Determines thickness of tails.
As the degrees of freedom increase, the shape of the t-distribution approaches the normal distribution.
Conclusion
There are too many terms that existed which I maybe write another article in near future.
That depends both on the statistics of that article and my path.
If you want a follow-up article to that one, do not forget “thumbs up” and follow me.
Thanks again.
“Machine learning is the last invention that humanity will ever need to make.” Nick Bostrom
Statistics for Machine Learning A-Z was originally published in Towards AI on Medium, where people are continuing the conversation by highlighting and responding to this story.
Join thousands of data leaders on the AI newsletter. It’s free, we don’t spam, and we never share your email address. Keep up to date with the latest work in AI. From research to projects and ideas. If you are building an AI startup, an AI-related product, or a service, we invite you to consider becoming a sponsor.
Published via Towards AI
Towards AI Academy
We Build Enterprise-Grade AI. We'll Teach You to Master It Too.
15 engineers. 100,000+ students. Towards AI Academy teaches what actually survives production.
Start free — no commitment:
→ 6-Day Agentic AI Engineering Email Guide — one practical lesson per day
→ Agents Architecture Cheatsheet — 3 years of architecture decisions in 6 pages
Our courses:
→ AI Engineering Certification — 90+ lessons from project selection to deployed product. The most comprehensive practical LLM course out there.
→ Agent Engineering Course — Hands on with production agent architectures, memory, routing, and eval frameworks — built from real enterprise engagements.
→ AI for Work — Understand, evaluate, and apply AI for complex work tasks.
Note: Article content contains the views of the contributing authors and not Towards AI.
Related posts
Recent Posts


")

