


")
Sports Analytics 101 — Expected Threats (xT)
Last Updated on January 6, 2023 by Editorial Team
Author(s): Nitin Chauhan
Originally published on Towards AI the World’s Leading AI and Technology News and Media Company. If you are building an AI-related product or service, we invite you to consider becoming an AI sponsor. At Towards AI, we help scale AI and technology startups. Let us help you unleash your technology to the masses.
Sports Analytics 101 — Expected Threats (xT)
As part of the introduction series on sports analytics for beginners, I am writing a series of articles examining the impact and benefits of machine learning and data analytics. Throughout my life as an aspiring data scientist, I have always sought out guides that would help me gain a deeper understanding of sports analytics. In the years that I have spent researching and attending courses, I have come up with the concept of a guide titled Sports Analytics 101. My hope is that this guide will assist people like myself in better understanding and appreciating sports + data analytics.
Why Expected Threat (xT)?
From coaches to scouts to fans, one of the critical questions is how we evaluate the quality of a player based on data. We now understand that scoring many goals means they are good, and finding good scoring opportunities (having a high xG) is also essential. How do we value all those passes, dribbles, blocks, and interceptions?
A concept called expected Threat has been adopted by Athletic when discussing player and team performance. An example of such a probability map is provided below, which assigns a value to every point on a football field based on the probability that having the ball there will result in a goal.

What is the Expected Threat (xT)?
According to the expected threat model, matches are divided into possessions, which are periods in which the same team owns the ball. According to xT, (1) players act intentionally to increase the chances of scoring for their team, and (2) the chance of scoring can be adequately captured by considering only the ball’s location.
As a result of point (2), xT represents a game state solely by utilizing the current ball location. As a result, xT overlays a grid of M*N points over the pitch to divide it into zones. In the figure below, xT(z) is illustrated as a result of how threatening teams are at each zone z.
This chart shows the Expected Threat for different parts of the pitch. It shows how likely a goal will be scored, given that the team has possession at that location.
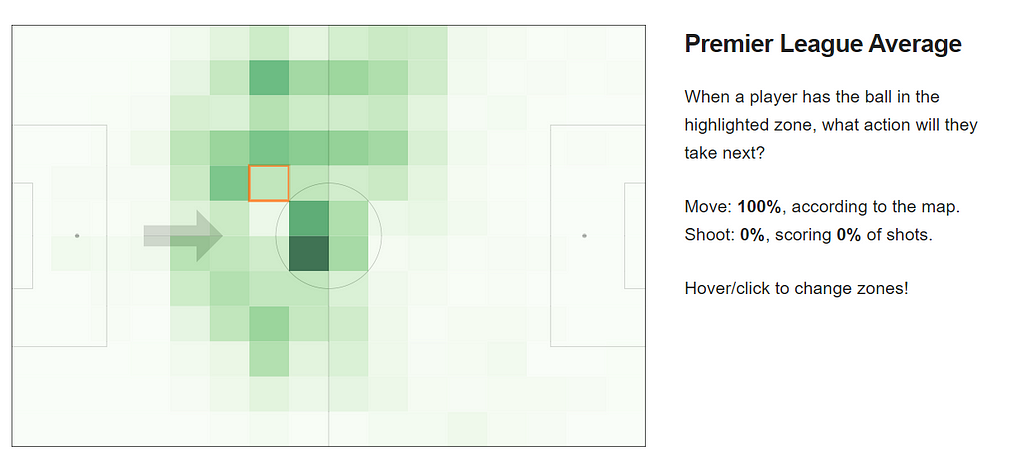
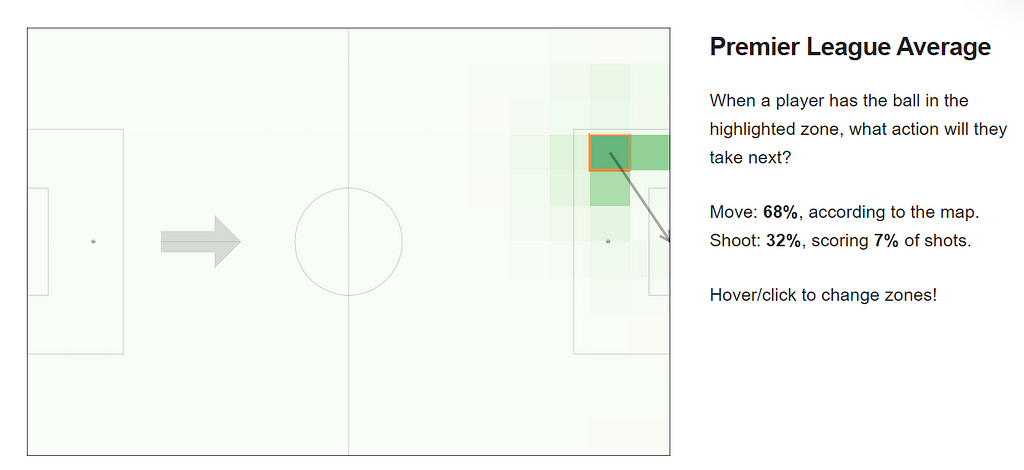
We evaluate actions based on their effect on the probability of scoring. The expected Threat (xT) is defined as the change in the likelihood of scoring. The player has increased the xT in favor of their team if they make a pass that moves the ball from a place where their team is unlikely to score to a place where they have a greater probability of scoring. There is a general rule that the closer you are to the goal, the more likely your team will score (although passes back to the goalkeeper can also be very valuable).
Utilizing the Expected Threat (xT) metric
Spaces are of greater value than others. The same is true on the football pitch. If you have the ball in your half, it is less valuable than if it is near the edge of your opponent’s box. We know those two things intuitively, but how do we measure them? The expected threat (xT, for short) is an effective solution for this problem for various reasons. Not all attacks are connected.
It was Sarah Rudd, who invented Expected Threat in 2011. She did not call it that. She did not call it anything at all, but she had the mathematical insight, using Markov chains, on which it was based, which you can see in this video. On this basis, she was recruited by StatDNA, which Arsenal acquired shortly after. Karun Singh first used the name xT in a blog post in 2018, and it was then repurposed in the public sphere.
When we see a clear example of a female scientist coming up with the idea that is now being used everywhere in a male-dominated area, it is added essential to pause and let others know where it came from. Science has a history of forgetting women’s contributions, and it would be embarrassing if we made the same mistake in football, especially in the modern era.
We should remember, therefore, that when we hear that Liverpool used expected goals added in recruitment during 2018–19 or that Opta and Statsbomb have their versions of expected Threat, this all came about because one very determined young woman went to as many sports analytics conferences as possible over the past ten years and pestered everyone she met until she gained one of the first jobs ever in football analytics.
With that clarified, I would like to make a more subtle point. There are many ways to measure expected Threats, as compared to expected goals. Our methodology at Twelve Football differs from that outlined above. Moreover, it is better… (I am not saying that it is better than what Rudd used at Arsenal, but there has been much progress since her talk in 2011) But if you have, for example, Opta, Statbomb, or Wyscout event data, this is the best method for implementing xT.
This is our logic. Football is a dynamic game. Passes are not simply valuable for where they end up but also for how they shift the defense. Therefore, we include both the start and end coordinates of a pass when calculating the Threat of a pass. We do not overvalue’ hopeful’ crosses in the box as well as qualifiers, such as whether it was a cross or a through ball.
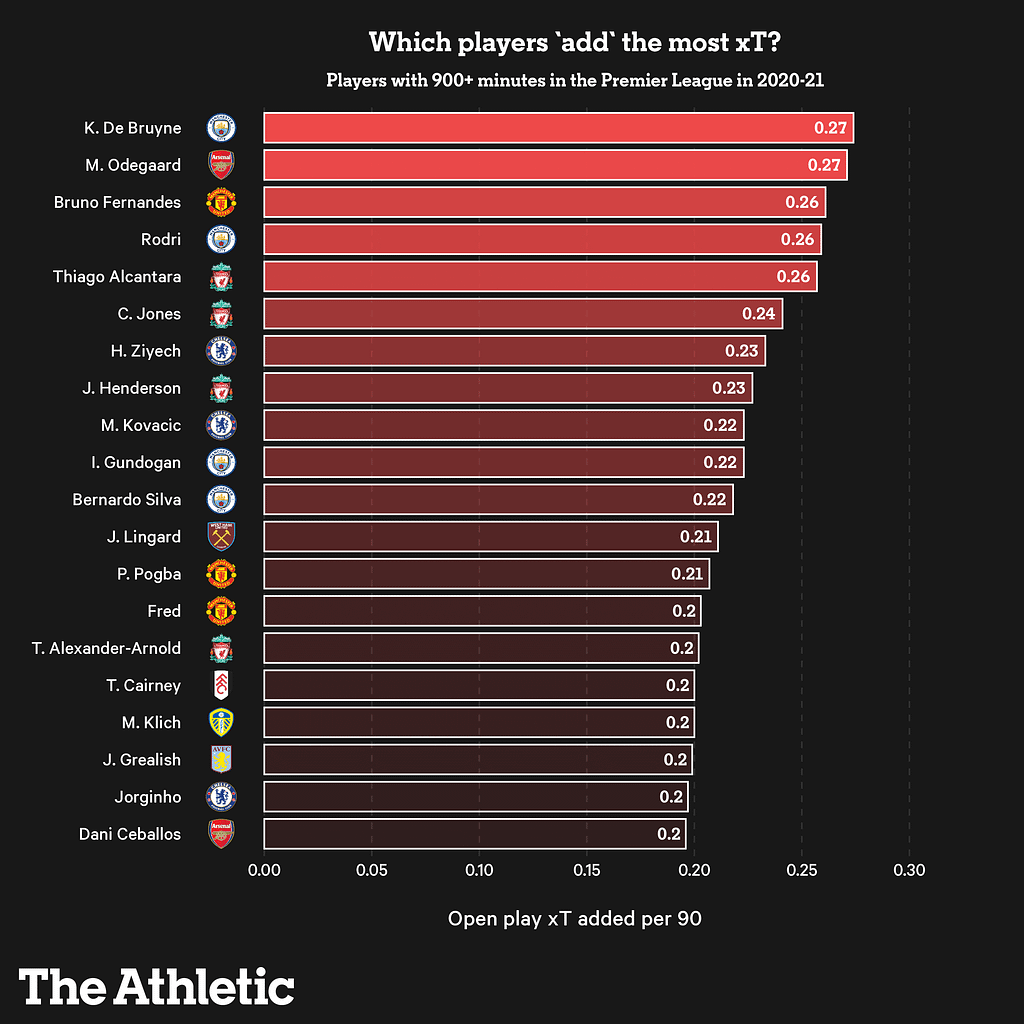
The Threat lies in how the ball is moved rather than where the ball is. As a result, cross-field balls are worth more, and backpasses do not result in minus points, as a purely change to XT might. Four of the best passers in the last third of last season have provided examples of valuable passes using the possession chain method.
The model recognizes the importance of Trent Alexander Arnold’s cross-balls. Ziyech’s Threat (ranked 7th) is primarily a result of shorter passes into the box, which ranked him third in the Premier League per 90 during the last third of the season. De Bruyne ranked first in the last third of the season.
This method is based on the power of possession chains. Every sequence of play is grouped based on who held the ball. When a team scores, the ball goes out of play, or the opposition touches the ball two times or more, a chain is broken. The video below illustrates how the value of a pass can be measured based on this.
Although we now keep our online rating site hidden (because we would like you to download our colorful app), you can still view them here.
Framework
To approach this problem quantitatively, you can use several existing frameworks:
- Assists are one way to look at contributions, but the numbers will go unnoticed by contributions like Ozil’s.
- This can be seen in xGChain, where the final shot’s xG (= 0.13 in this case) is equally shared amongst all participants. Kolasinac, Ozil, Aubameyang, Maitland-Niles, and Lacazette would receive the same amount of xGChain here, which does not reflect the genuine contribution. xGBuildup, another related quantity, divides xG equally among everyone involved before the assist (i.e., Ozil, Maitland-Niles, and Lacazette), but it suffers from the same problem.
- This is better, but a threatening pass is not always one that leads to a good shooting position. You can observe the differences in xG caused by each action. For example, Ozil’s pass split the defense open, but Kolasinac did not receive it in an ideal shooting position. Ozil’s pass is unique because it provides Kolasinac with an opportunity from which he can easily create a good chance.
Prospective Future Inclusions
To overcome the deficiencies of existing approaches, we would like to create a framework that can:
- Reward individual player actions (passes, dribbles) in buildup play.
- Due to availability constraints, operate on event-level data.
- Reward actions are independent of the end outcome of the possession (i.e., Ozil’s reward shouldn’t depend on Aubameyang shooting or scoring).
- Reward moving the ball not just into high-xG shooting positions but also into ‘threatening’ positions that can, in turn, lead to high-xG shooting positions with high likelihood.
As always, there is a trade-off between modeling complexity and accuracy. No one solution is ‘correct’ here. However, the purpose of this post is to introduce one possible modeling approach and demonstrate how it can be implemented and used to analyze buildup play.
Key Takeaways
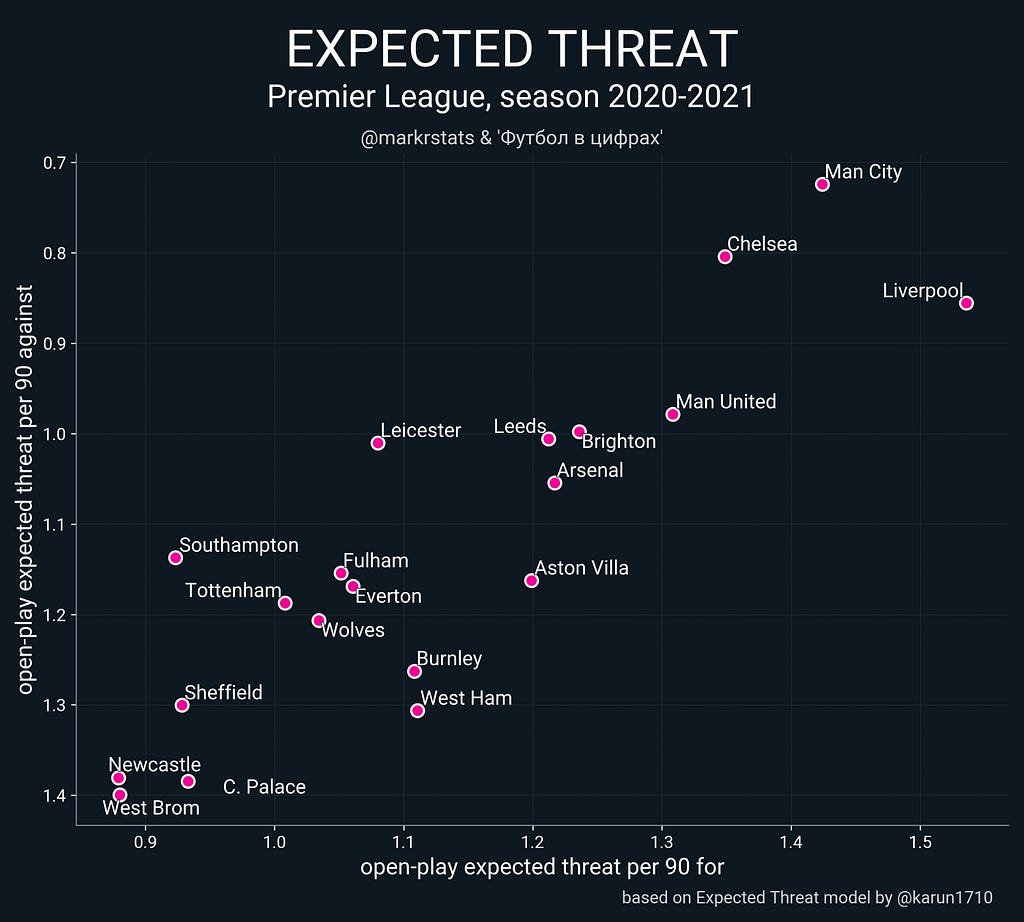
It is imperative to determine the probability of scoring a goal as football is a relatively low-scoring sport. As a result of the expected threat, pundits and analysts can quantify the stories that football fans want to hear with another tool. Which team is struggling with their creativity & finishing? Which team’s performance suggests they should be higher up the league table?
References
- Introducing Expected threat — https://karun.in/blog/expected-threat.html
- Introduction of expected threat ‘new metric’ on the block — https://theathletic.com/2751525/2021/08/06/introducing-expected-threat-or-xt-the-new-metric-on-the-block/
For a new blog, or article alerts click subscribe. Also, feel free to connect with me on LinkedIn, and let’s be part of an engaging network.
Sports Analytics 101 — Expected Threats (xT) was originally published in Towards AI on Medium, where people are continuing the conversation by highlighting and responding to this story.
Join thousands of data leaders on the AI newsletter. It’s free, we don’t spam, and we never share your email address. Keep up to date with the latest work in AI. From research to projects and ideas. If you are building an AI startup, an AI-related product, or a service, we invite you to consider becoming a sponsor.
Published via Towards AI
Towards AI Academy
We Build Enterprise-Grade AI. We'll Teach You to Master It Too.
15 engineers. 100,000+ students. Towards AI Academy teaches what actually survives production.
Start free — no commitment:
→ 6-Day Agentic AI Engineering Email Guide — one practical lesson per day
→ Agents Architecture Cheatsheet — 3 years of architecture decisions in 6 pages
Our courses:
→ AI Engineering Certification — 90+ lessons from project selection to deployed product. The most comprehensive practical LLM course out there.
→ Agent Engineering Course — Hands on with production agent architectures, memory, routing, and eval frameworks — built from real enterprise engagements.
→ AI for Work — Understand, evaluate, and apply AI for complex work tasks.
Note: Article content contains the views of the contributing authors and not Towards AI.
Related posts
Recent Posts


