


")
Sports Analytics 101 — Expected Goals (xG)
Last Updated on August 2, 2022 by Editorial Team
Author(s): Nitin Chauhan
Originally published on Towards AI the World’s Leading AI and Technology News and Media Company. If you are building an AI-related product or service, we invite you to consider becoming an AI sponsor. At Towards AI, we help scale AI and technology startups. Let us help you unleash your technology to the masses.
Sports Analytics 101 — Expected Goals (xG)
As part of the introduction series on sports analytics for beginners, I am writing a series of articles examining the impact and benefits of machine learning and data analytics. Throughout my life as an aspiring data scientist, I have always sought out guides that would help me gain a deeper understanding of sports analytics. In the years that I have spent researching and attending courses, I have come up with the concept of a guide titled Sports Analytics 101. My hope is that this guide will assist people like myself in better understanding and appreciating sports + data analytics.
Why Expected Goals (xG)?
Over the past few years, football has become increasingly dependent on data and statistics. One of the most widely used and insightful football analytics metrics is expected goals (or xG). It was introduced by Opta’s Sam Green in 2012 and has since become one of the most widely used metrics.
It has now become a regular feature for mainstream broadcasters such as Sky Sports and BBC’s Match of the Day, following the early adoption of expected goals in the betting and professional markets. From the laptops of analysts to the mouths of Premier League managers, xG has gained popularity. In recent interviews, Jurgen Klopp has compared Liverpool’s expected goals output with Manchester City’s, while Dean Smith has used the metric to discuss Aston Villa’s performance this season.
Over the past few years, expected goals have inevitably been criticized by general football fans who have become increasingly aware of it (see Jeff Stelling in 2017) — traditionally viewed games versus the upcoming world of data analytics. However, before judging the metric, it is vital to comprehend how the metric operates and how it should be utilized.
What Are Expected Goals (xG)?
By calculating the probability that a given opportunity will be scored from a particular location on a pitch during a specific phase of play, expected goals (xG) are calculated to determine the quality of a chance. As a result of these calculations, several factors were taken into account before the shot was taken. In terms of xG, zero represents the likelihood that a player is unlikely to score, while one represents the likelihood that they are likely to score consistently.
In such a situation, a player is less likely to score a goal from the halfway line than from within the box. By quantifying xG, we can assess the probability of a player scoring from each of these situations. As an example, assume that the chance of a player scoring inside the box with a set of pre-shot characteristics is worth 0.1 xG. Thus, in this situation, a player will likely score one goal out of every ten shots, or 10% of the time.
Football fans and commentators had used these phrases for years before xG was introduced — “he scores that nine out of ten times” or “he should have had a hat-trick.”
Standard Misinterpretations about xG
Most criticisms of expected goals (xG) arise from an incorrect metric application. One example of this is the game level. Having the highest xG in a match does not necessarily imply the team should have won. xG is a measure of chance quality, not the expected outcome. Goals change games, and scorelines influence how teams play, just as the old saying goes. If a team takes an early lead, they do not necessarily ‘need’ to generate more chances. We typically expect the opposition to create more scoring chances during the remainder of the game to make a comeback.
Secondly, there is a misconception regarding the literal interpretation of the metric name. We do not “expect” goals to occur precisely as the likelihood predicts. Additionally, fractions of goals cannot be achieved. A measure of the probability of an outcome occurring is known as an “expected goal,” derived from the mathematical concept of “expected value.” The expected value of a fair coin toss is 50% on heads and 50% on tails (the probability of landing on heads is 0.5). Rather than expecting exactly half of our tosses to land on each outcome, we anticipate a regress to this balance over a more significant number of coin tosses. Expected goals are no different. Variances from the expected values are inevitable, and this is valuable information we can utilize to analyze football scores.
As the Gambler’s Fallacy indicates, if a player or team has been overperforming their xG, they do not need to underperform to regress to expectation. Even though we expect them to revert to scoring as they expected with their future shots, they have already ‘banked’ this overperformance. As a result, we should expect them to still overperform by this amount in the aggregates throughout the season. In the same way, a coin toss that lands on heads ten times in a row is equally likely to land on heads as tails in the future, but the ten times it has already landed on heads are already behind us.
Calculating the Expected Goals (xG)
We can tell intuitively which chances were more or less likely to end in goals based on factors such as how close the shooter was to the goal, whether they shot from a good angle, whether it was one-on-one or whether it was a header.
As a result, we have to work out the probability for an average of 25 shots per game, all of which can be the result of unique circumstances. We can now quantify the effects of the variables above and others on the likelihood that a goal will be scored using our expected goals model. We can value the quality of the chances for all 9,398 shots taken in the Premier League 2019–20 season within seconds.
Statistics Perform’s xG model is built using a logistic regression model that is derived from hundreds of thousands of shots gathered from our historical Opta data and incorporates several variables that affect a player’s chances of scoring a goal, including the following:
- Goal angle
- Distance from the goal
- Chances are high
- Part of the body (for example, the head or the foot)
- In one-on-one situations
- Assist type (e.g., through ball, cross, pull-back, etc.)
- The kind of play (e.g., open space, fast break, direct free kick, corner kick, throw-in, etc.)
Recognizing the uniqueness of some situations, we also model these independently. Penalties are given a constant value corresponding to their overall conversion rate (0.79 xG); direct free kicks have their model, and headed chances are valued differently for set-pieces and open play.
An upcoming model version will include shot pressure and shot clarity qualifiers on every shot, which explicitly measure the pressure and positioning of defenders and goalkeepers.
Utilizing the Expected Goals (xG)
In the Premier League and Serie A, Gabriel Jesus of Manchester City and Hakan Calhanoglu of AC Milan are compared. Despite taking exactly 100 shots last season (excluding penalties), both players scored 14 and 8 goals, respectively. Why did their shots differ?
By quantifying the quality of each player’s 100 chances, xG provides a deeper understanding of their shots, going beyond traditional metrics such as shots on target or average shot distance.
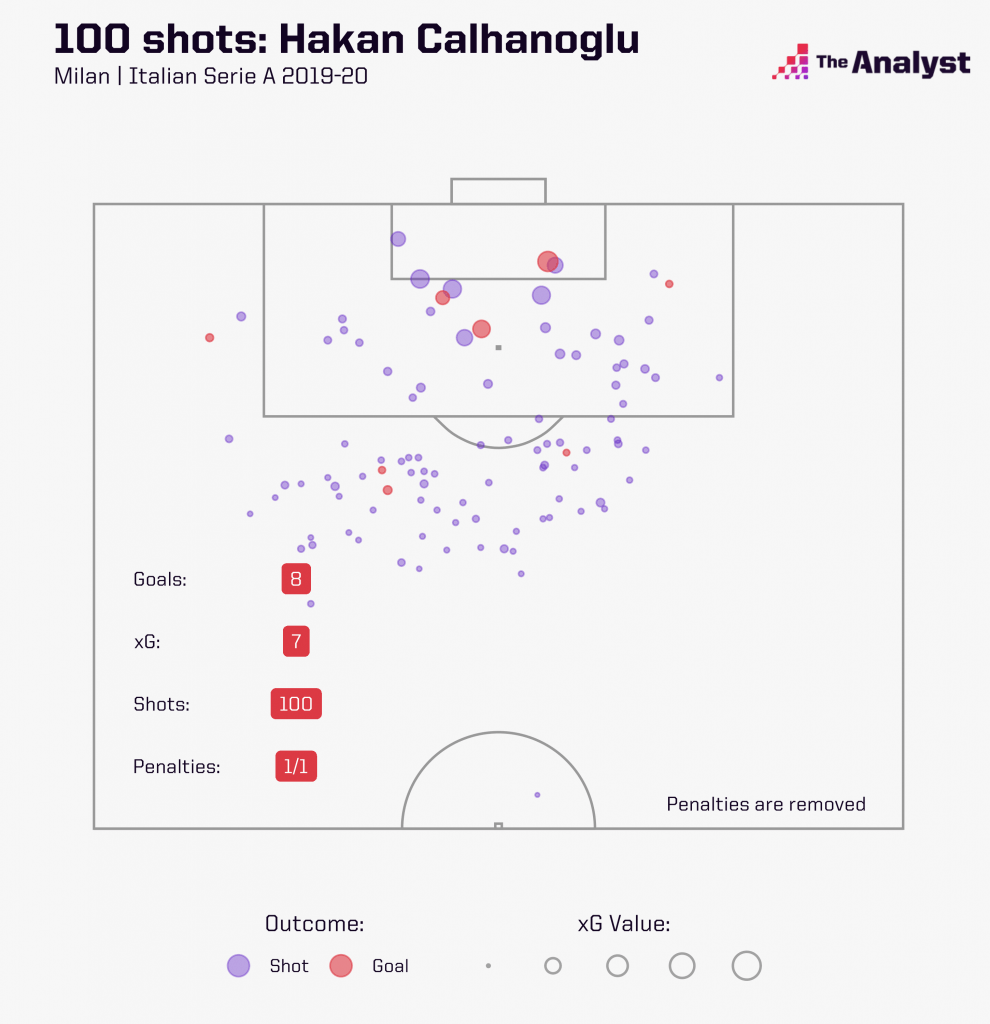
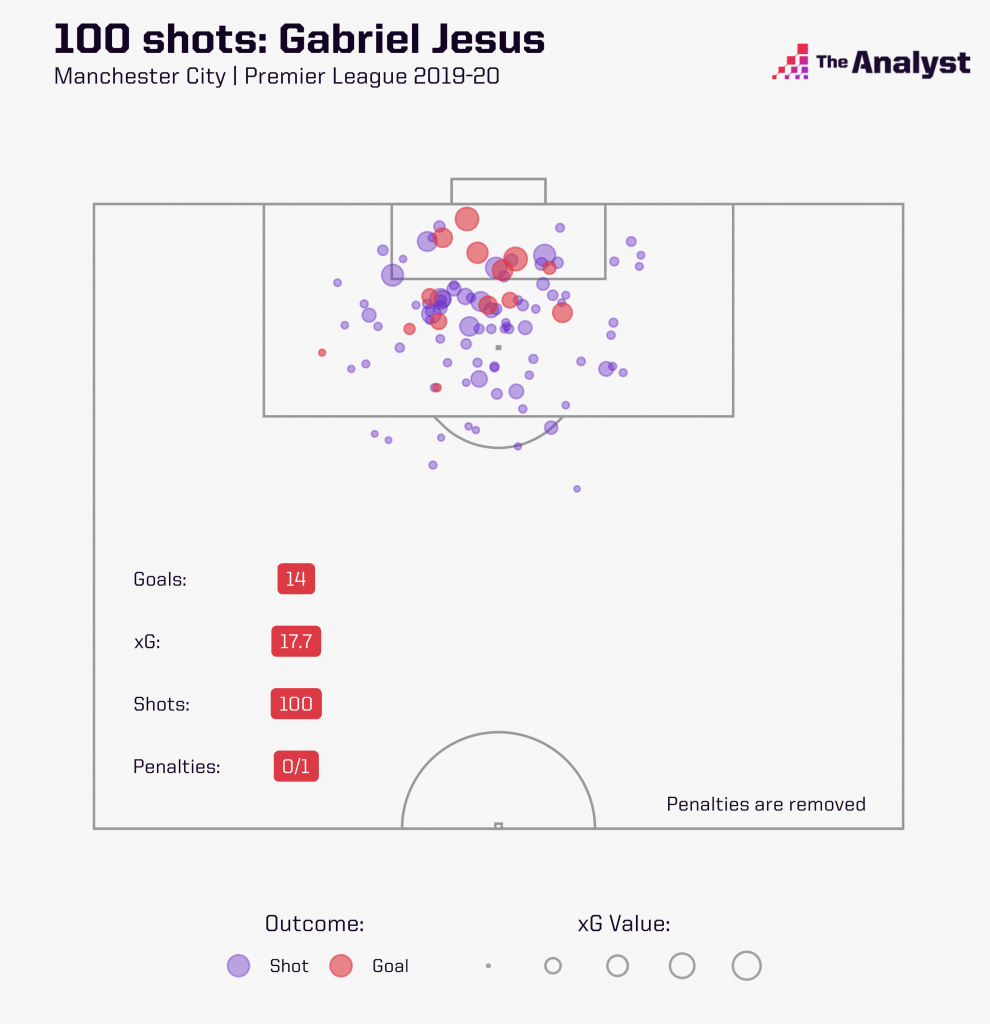
The average player would score nearly 18 goals (17.7 xG) based on Gabriel Jesus’ chances. On the other hand, based on Hakan Calhanoglu’s chances, an average player would score only 7 goals (7.0 xG). We can immediately understand the reason for their differences in goal-scoring output. Although Jesus exceeded expectations and Calhanoglu underperformed slightly based on their expected goal output, their 100 chances were very different in quality, reflecting this.
A player’s shot profile can be compared by determining his expected goals per shot (or xG per shot), a measure of the average quality of his scoring chances. According to Gabriel Jesus, he scored approximately one goal for every five attempts he took based on his xG per shot, which was 0.18. In contrast, Calhanoglu’s shots have a much lower xG per shot (0.07), as can be seen in his shot map above, where a larger dot indicates a higher xG value.
While we have focused on individual players here, the expected goals metric can also be similarly applied to teams or games. A player or team may score more or less frequently than their xG value indicates, but this variance is exactly the variance that can now be analyzed. Is a player scoring less than what he should be? Who is receiving chances from high xG situations?
Key Takeaways
Considering that football is a relatively low-scoring sport, determining the likelihood of scoring a goal is crucial. As a result of expected goals, pundits and analysts can quantify the stories that every football fan wants to hear with another tool. Which striker is struggling with their finishing? Which team’s performance suggests they should be higher up the league table?
As a result of the unmatched depth of Stats Perform’s data, we now have over 2,500,000 shots enriched with xG values for over 66,000 players allowing us to compare and understand the performances of players and teams worldwide.
An essential aspect of the statistic is determining how good a team is at creating opportunities and how good a forward is at acquiring options. Based on the work with expected goals, general analytics consensus suggests that a player’s ability to receive chances — as measured by xG — significantly affects what makes a good striker more than their ability to finish.
References:
- The Analyst https://theanalyst.com/eu/2021/07/what-are-expected-goals-xg/
- Goal Expectancy Stats https://indinews.com/2022/07/goal-expectancy-statistics/
- Twenty3 https://www.twenty3.sport/introducing-twenty3-advanced-metrics/
For a new blog, or article alerts click subscribe. Also, feel free to connect with me on LinkedIn, and let’s be part of an engaging network.
Sports Analytics 101 — Expected Goals (xG) was originally published in Towards AI on Medium, where people are continuing the conversation by highlighting and responding to this story.
Join thousands of data leaders on the AI newsletter. It’s free, we don’t spam, and we never share your email address. Keep up to date with the latest work in AI. From research to projects and ideas. If you are building an AI startup, an AI-related product, or a service, we invite you to consider becoming a sponsor.
Published via Towards AI
Towards AI Academy
We Build Enterprise-Grade AI. We'll Teach You to Master It Too.
15 engineers. 100,000+ students. Towards AI Academy teaches what actually survives production.
Start free — no commitment:
→ 6-Day Agentic AI Engineering Email Guide — one practical lesson per day
→ Agents Architecture Cheatsheet — 3 years of architecture decisions in 6 pages
Our courses:
→ AI Engineering Certification — 90+ lessons from project selection to deployed product. The most comprehensive practical LLM course out there.
→ Agent Engineering Course — Hands on with production agent architectures, memory, routing, and eval frameworks — built from real enterprise engagements.
→ AI for Work — Understand, evaluate, and apply AI for complex work tasks.
Note: Article content contains the views of the contributing authors and not Towards AI.
Related posts
Recent Posts


")

