


SAS Python Interaction
Last Updated on April 14, 2021 by Editorial Team
Author(s): Vivek Chaudhary
Programming
The objective of this article is to understand Python 3.x interaction with SAS 9.4 university edition. Read SAS datasets using python pandas library and manipulate datasets and write the result back to SAS.
SAS University Edition is free SAS software that can be used for teaching and learning statistics and quantitative methods. The scope of this article is however limited to ETL operations with SAS and Python.
#Note: Assuming SAS University edition is installed.
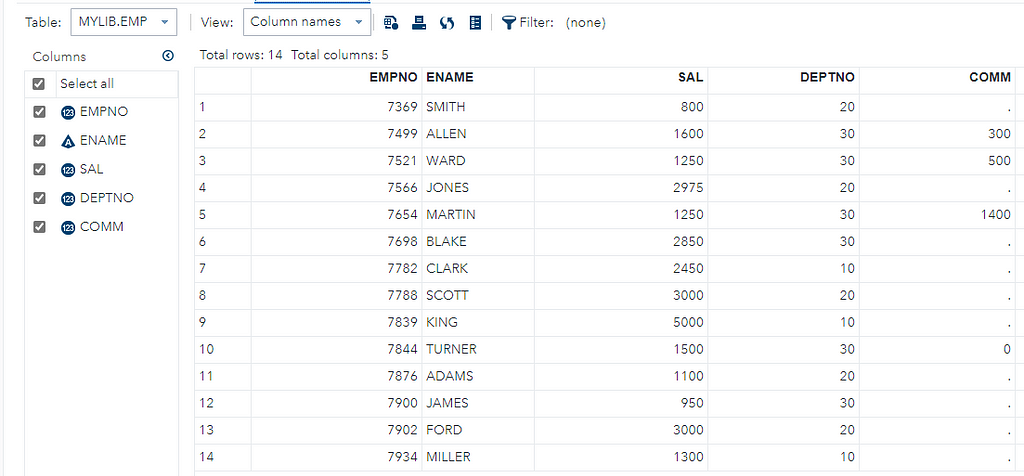
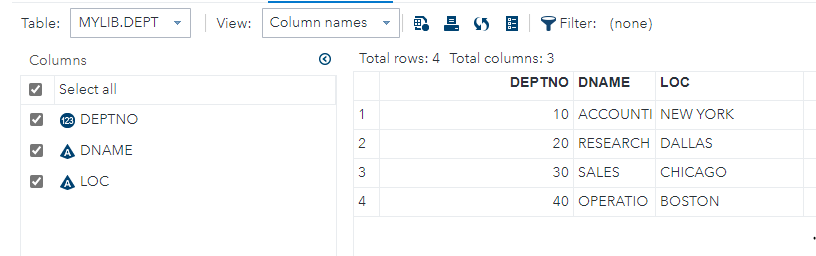
- SAS Library and Datasets
A SAS library is a collection of one or more SAS files/datasets that are recognized by SAS and that are referenced and stored as a unit. Whenever a new session is created SAS automatically creates two libraries Work, temporary library, and SASUSER, permanent library.
A SAS dataset is a table with columns and rows. In SAS, the table is called a data set, a column is called a variable, and a row is called an observation. In each observation, each variable has a specific value.
In simple terms or DB terms, a SAS library can be construed as a schema whereas a SAS dataset can be understood as a DB table with a matrix structure having rows and columns.
2. Create Library and Dataset
SAS command to create a library:
libname mylib ‘<path>’;
SAS command to create a dataset:
DATA mylib.emp;
 infile ‘<path>/emp.csv’
 dlm=’,’
 FIRSTOBS=2 DSD;
 input EMPNO ENAME $ SAL DEPTNO COMM;
run;
DATA mylib.dept;
 infile ‘<path>/dept.csv’
 dlm=’,’
 FIRSTOBS=2 DSD;
 input DEPTNO DNAME $ LOC $;
run;
Datasets in SAS are stored on the disk with SAS data format: sas7bdat.
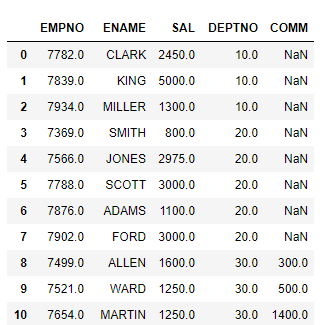
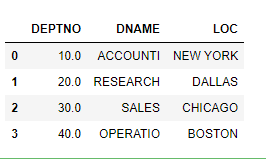
3. Read SAS dataset using Python
import pandas as pd
emp_df= pd.read_sas(r’D:\VirtualMs\SAS University Edition\myfolders\emp.sas7bdat’,encoding=’utf-8')
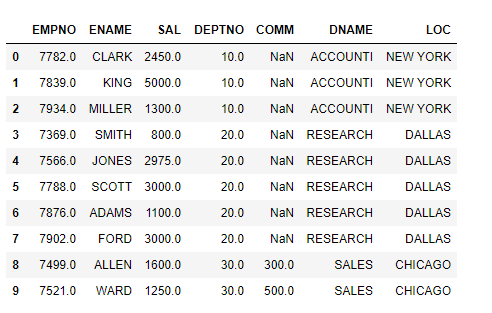
emp_df.head(10)
dept_df= pd.read_sas(r’D:\VirtualMs\SAS University Edition\myfolders\dept.sas7bdat’,encoding=’utf-8')
dept_df.head(10)
Data Manipulation step, apply an equijoin to merge emp and dept datasets.
final_df=pd.merge(emp_df,dept_df[[‘DEPTNO’,’DNAME’,’LOC’]],on=’DEPTNO’,how=’inner’)
final_df.head(10)
Write Pandas dataframe to disk:
final_df.to_csv(‘D:\VirtualMs\SAS University Edition\myfolders\emppy.csv’,index=False)
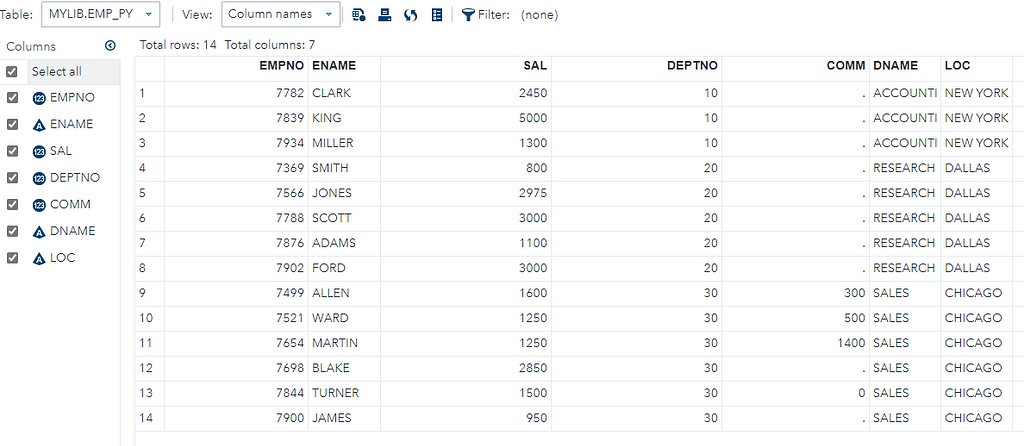
4. Create a SAS Table from the CSV file
SAS program to create a table from the CSV file:
DATA mylib.emp_py;
 infile ‘/folders/myfolders/emppy.csv’
 dlm=’,’
 FIRSTOBS=2 DSD;
 input EMPNO ENAME $ SAL DEPTNO COMM DNAME $ LOC $;
run;
Explanation of the above program:
Data Step: This step involves loading the required data set into SAS memory and identifying the variables (also called columns) of the data set. It also captures the records also called observations.
Infile: specify the input file path and name along with delimiter dlm, in our case ‘,’ due to the CSV file.
FIRSTOBS: specify the line to start reading from, 2 means skip header and read from the first observation, which is the actual header.
To summarize, we have successfully read datasets from SAS using the Python Pandas library and written back the dataset to the disk, and then created a table out of the same dataset. That’s all for this blog.
Thank you for supporting the content.
SAS Python Interaction was originally published in Towards AI on Medium, where people are continuing the conversation by highlighting and responding to this story.
Published via Towards AI
Towards AI Academy
We Build Enterprise-Grade AI. We'll Teach You to Master It Too.
15 engineers. 100,000+ students. Towards AI Academy teaches what actually survives production.
Start free — no commitment:
→ 6-Day Agentic AI Engineering Email Guide — one practical lesson per day
→ Agents Architecture Cheatsheet — 3 years of architecture decisions in 6 pages
Our courses:
→ AI Engineering Certification — 90+ lessons from project selection to deployed product. The most comprehensive practical LLM course out there.
→ Agent Engineering Course — Hands on with production agent architectures, memory, routing, and eval frameworks — built from real enterprise engagements.
→ AI for Work — Understand, evaluate, and apply AI for complex work tasks.
Note: Article content contains the views of the contributing authors and not Towards AI.
Related posts
Recent Posts


")