


Multi-class Model Evaluation with Confusion Matrix and Classification Report
Last Updated on January 6, 2023 by Editorial Team
Last Updated on September 30, 2022 by Editorial Team
Author(s): Saurabh Saxena
Originally published on Towards AI the World’s Leading AI and Technology News and Media Company. If you are building an AI-related product or service, we invite you to consider becoming an AI sponsor. At Towards AI, we help scale AI and technology startups. Let us help you unleash your technology to the masses.
Model Evaluation
Precision, Recall, F1, Micro, Macro, Weighted, and Classification Report
If you are familiar with the Confusion Matrix, you might know that it is mainly explained for binary classification, which has only two outputs. TP, TN, FP, FN, and other derived metrics like precision and recall are convenient to understand. However, it is not the same case when we have more than two target classes.
In this blog, Focus will be on the problem with more than two classes or, in other words, Multi-class classification. Unlike binary classification, there is no negative class. It is a perception that TP, TN, and other metrics are difficult to derive out of the confusion matrix for multi-class but actually, it is quite easy.
In multi-class classification, all the metrics be it TP, precision, or any other metric, are calculated the same as in binary, except it needs to be calculated for each class. We can pretty much derive any metric for a class if we compute TP, TN, FP, and FN for a respective class.

TP, FP, and FN can be deduced from the matrix if we look for a particular class from both dimensions, and the rest of the numbers will contribute to TN. Other metrics can also be derived in the same fashion. Please visit Introduction to Confusion Matrix and Deep dive into Confusion Matrix to read about What Confusion Matrix is and how precision, recall, and many other metrics are derived from it.
Let us understand how to calculate metrics for multi-class; for simplicity, we will consider the problem with 3 classes (airplane, car, train).
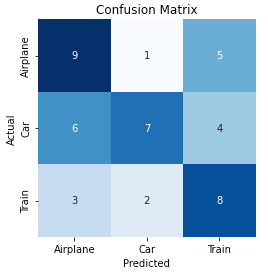
## Calculation of class “Airplane”:
TP = 9
FN = 1+5 = 6
FP = 6+3 = 9
TN = 7+4+2+8 = 21
Precision = TP/(TP+FP) = 9/(9+9) = 0.5
Recall = TP/(TP+FN) = 9/(9+6) = 0.6
F1 = 2*(0.5*0.6)/(0.5+0.6) = 5.55
Similarly, we can calculate for the other classes. However, this time we will use sklearn metrics API to produce precision, recall, and f1 score.
from sklearn.metrics import confusion_matrix
from sklearn.metrics import precision_score
y_true = [0]*15 + [1]*17 + [2]*13
y_pred = [0]*9 + [1]*1 + [2]*5 + [0]*6 + [1]*7 + [2]*4 + [0]*3 + [1]*2 + [2]*8
confusion_matrix(y_true, y_pred, labels=[0,1,2])
Output:
array([[9, 1, 5],
       [6, 7, 4],
       [3, 2, 8]])
The above example is to calculate the confusion matrix, which returns ndarray, and if labels are not hot-encoded, we have to provide a set of labels against the ‘labels’ argument.
Precision: It is referred to the proportion of correct predictions among all predictions for a particular class.
from sklearn.metrics import precision_score
precision_score(y_true, y_pred, labels=[0,1,2], average=None)
Output:
array([0.5       , 0.7       , 0.47058824])
Recall: It is referred to the proportion of examples of a specific class that have been predicted by the model as belonging to that class.
from sklearn.metrics import recall_score
recall_score(y_true, y_pred, labels=[0,1,2], average=None)
Output:
array([0.6       , 0.41176471, 0.61538462])
F1 Score: The Harmonic mean of precision and recall.
from sklearn.metrics import f1_score
f1_score(y_true, y_pred, labels=[0,1,2], average=None)
Output:
array([0.54545455, 0.51851852, 0.53333333])
The ‘average’ argument in the above evaluation methods needs to be None which return an array of metric respective to individual class.
In multi-class, we have observed that precision has been calculated for individual classes, while in binary class problems, we had a single value. If we want to evaluate multi-class with one global metric, we have micro, macro, and weighted precision. Any metric from the confusion matrix can be combined with micro, macro, and weighted to make it a global metric.
Micro Precision: It is calculated by considering the total TP, TN, FN, and TN irrespective of class to calculate Precision.
- Global TP = TP(airplane) + TP(car) + TP(train) = 9+7+8 = 24
- Global FP = FP(A) + FP(C) + FP(T) = (6+3) + (1+2) + (5+4) = 21
- Micro Precision = 24/(24+21) = 0.533
from sklearn.metrics import precision_score
precision_score(y_true, y_pred, labels=[0,1,2], average='micro')
Output:
0.5333333333333333
Macro Precision: It is referred to as the unweighted mean of the measure for each class.
- Macro Precision = (0.50 + 0.70 + 0.47)/3 = 0.556
from sklearn.metrics import precision_score
precision_score(y_true, y_pred, labels=[0,1,2], average='macro')
Output:
0.5568627450980391
Weighted Precision: Unlike macro, it is the weighted mean of the measure. Weights are the total number of samples per class. In our example, we have 15 airplanes, 17 cars, and 13 trains which aggregated to 45 in total.
- Weighted Precision = (15*0.50 + 17*0.70 + 13*0.47)/45 = 0.566
from sklearn.metrics import precision_score
precision_score(y_true, y_pred, labels=[0,1,2], average='weighted')
Output:
0.5670588235294117
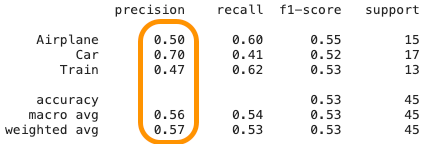
What is Classification Report?
It is a python method under sklearn metrics API, useful when we need class-wise metrics alongside global metrics. It provides precision, recall, and F1 score at individual and global levels. Here support is the count of samples. Classification Report in sklearn calculates all necessary metrics for evaluation.
from sklearn.metrics import classification_report
report = classification_report(y_true, y_pred, labels=[0,1,2], target_names=["Airplane", "Car", "Train"])
print(report)
Output:
              precision    recall  f1-score   support
    Airplane       0.50      0.60      0.55        15
         Car       0.70      0.41      0.52        17
       Train       0.47      0.62      0.53        13
    accuracy                           0.53        45
   macro avg       0.56      0.54      0.53        45
weighted avg       0.57      0.53      0.53        45
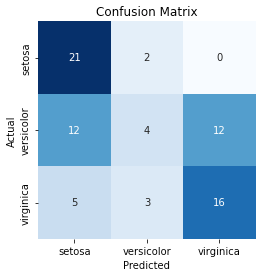
Below is the code for plotting confusion Matrix and Detailed Classification Report
import numpy as np
from sklearn.datasets import load_iris
from sklearn.model_selection import train_test_split
from sklearn.linear_model import LogisticRegression
from . import confusion_matrix
# Load Dataset
data = load_iris()
X = data.data
y = data.target
labels = list(data.target_names)
# Adding Noise
random_state = np.random.RandomState(0)
n_samples, n_features = X.shape
X = np.concatenate([X,
                    random_state.randn(n_samples, 200* n_features)],
                                       axis=1)
X_train, X_test, y_train, y_test = train_test_split(
    X[y < 3], y[y < 3], test_size=0.5, random_state=random_state)
lr = LogisticRegression()
lr.fit(X_train, y_train)
y_pred = lr.predict(X_test)
y_pred_prob = lr.predict_proba(X_test)
confusion_matrix(y_test, y_pred, labels)
If you are wondering about the “from . import confusion_matrix”, please refer to the Introduction to Confusion Matrix for the Python method.
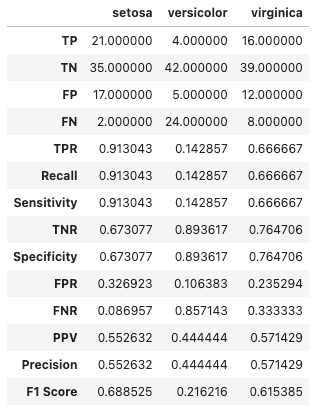
multi_classification_report(y_test, y_pred, labels=labels, encoded_labels=True, as_frame=True)
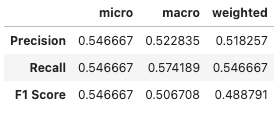
summarized_classification_report(y_test, y_pred, as_frame=True)
I hope this blog and the series of others (mentioned in references) will help you build a clear understanding of the confusion matrix.
Suggestions and questions are welcome, please share them in the comment.
References:
[1] sklearn metrics API. https://scikit-learn.org/stable/modules/classes.html#module-sklearn.metrics
[2] Introduction to Confusion Matrix. https://pub.towardsai.net/introduction-to-confusion-matrix-50676f2756ee
[3] Deep dive into Confusion Matrix. https://pub.towardsai.net/deep-dive-into-confusion-matrix-6b8111d5c3f7
Multi-class Model Evaluation with Confusion Matrix and Classification Report was originally published in Towards AI on Medium, where people are continuing the conversation by highlighting and responding to this story.
Join thousands of data leaders on the AI newsletter. It’s free, we don’t spam, and we never share your email address. Keep up to date with the latest work in AI. From research to projects and ideas. If you are building an AI startup, an AI-related product, or a service, we invite you to consider becoming a sponsor.
Published via Towards AI
Towards AI Academy
We Build Enterprise-Grade AI. We'll Teach You to Master It Too.
15 engineers. 100,000+ students. Towards AI Academy teaches what actually survives production.
Start free — no commitment:
→ 6-Day Agentic AI Engineering Email Guide — one practical lesson per day
→ Agents Architecture Cheatsheet — 3 years of architecture decisions in 6 pages
Our courses:
→ AI Engineering Certification — 90+ lessons from project selection to deployed product. The most comprehensive practical LLM course out there.
→ Agent Engineering Course — Hands on with production agent architectures, memory, routing, and eval frameworks — built from real enterprise engagements.
→ AI for Work — Understand, evaluate, and apply AI for complex work tasks.
Note: Article content contains the views of the contributing authors and not Towards AI.
Related posts
Recent Posts


")
