


Machine Learning Project in Python Step-By-Step – Predicting Employee Attrition
Last Updated on February 22, 2023 by Editorial Team
Author(s): Fares Sayah
Originally published on Towards AI.
Machine Learning Project in Python Step-By-Step — Predicting Employee Attrition
AI for Human Resources: Predict attrition of your valuable employees using Machine Learning
Human Resources & AI
An organization’s human resources (HR) function deals with the most valuable asset: people. Human resources play an important role in the success of a business. Human resources face many challenges, and AI can help automate and solve some of these challenges.
AI can help Human Resources with several tasks. In talent acquisition, AI can help by filtering resumes that best fit the job description and talent development by recommending programs that suites each employee’s skills and goals.
On the other hand, AI may face a lot of challenges in HR, like Low volume of historical data, Privacy concerns of employees, and low priority for AI projects.
Predicting Employee Attrition
Employee attrition is one of the major concerns for an HR organization because it will cause losses of expertise, losses of productivity, customer goodwill, hiring costs, training costs, and so on. Employee leaves due to various reasons such as compensation, work satisfaction, performance, supervisors, and so on.
First of all, HR needs to collect comprehensive data about an employee, such as education, salary, experience… We also need data from supervisors such as performance, relationships, promotions…
After that, HR can use this information to predict employees’ tendency to leave and take preventive action.
Exploratory Data Analysis
In-depth EDA can be found in the full notebook: IBM HR Analytics💼Employee Attrition & Performance
<class 'pandas.core.frame.DataFrame'>
RangeIndex: 1470 entries, 0 to 1469
Data columns (total 35 columns):
 #   Column                    Non-Null Count  Dtype
---  ------                    --------------  -----
 0   Age                       1470 non-null   int64
 1   Attrition                 1470 non-null   object
 2   BusinessTravel            1470 non-null   object
 3   DailyRate                 1470 non-null   int64
 4   Department                1470 non-null   object
 5   DistanceFromHome          1470 non-null   int64
 6   Education                 1470 non-null   int64
 7   EducationField            1470 non-null   object
 8   EmployeeCount             1470 non-null   int64
 9   EmployeeNumber            1470 non-null   int64
 10  EnvironmentSatisfaction   1470 non-null   int64
 11  Gender                    1470 non-null   object
 12  HourlyRate                1470 non-null   int64
 13  JobInvolvement            1470 non-null   int64
 14  JobLevel                  1470 non-null   int64
 15  JobRole                   1470 non-null   object
 16  JobSatisfaction           1470 non-null   int64
 17  MaritalStatus             1470 non-null   object
 18  MonthlyIncome             1470 non-null   int64
 19  MonthlyRate               1470 non-null   int64
 20  NumCompaniesWorked        1470 non-null   int64
 21  Over18                    1470 non-null   object
 22  OverTime                  1470 non-null   object
 23  PercentSalaryHike         1470 non-null   int64
 24  PerformanceRating         1470 non-null   int64
 25  RelationshipSatisfaction  1470 non-null   int64
 26  StandardHours             1470 non-null   int64
 27  StockOptionLevel          1470 non-null   int64
 28  TotalWorkingYears         1470 non-null   int64
 29  TrainingTimesLastYear     1470 non-null   int64
 30  WorkLifeBalance           1470 non-null   int64
 31  YearsAtCompany            1470 non-null   int64
 32  YearsInCurrentRole        1470 non-null   int64
 33  YearsSinceLastPromotion   1470 non-null   int64
 34  YearsWithCurrManager      1470 non-null   int64
dtypes: int64(26), object(9)
memory usage: 402.1+ KB
We notice that ‘EmployeeCount', 'Over18', 'StandardHours' have only one unique value and 'EmployeeNumber' has 1470 unique values. These features aren't useful for us, So we are going to drop those columns.
Conclusions:
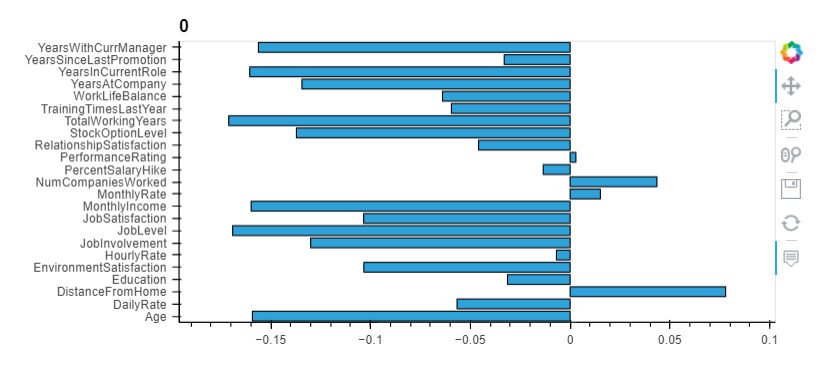
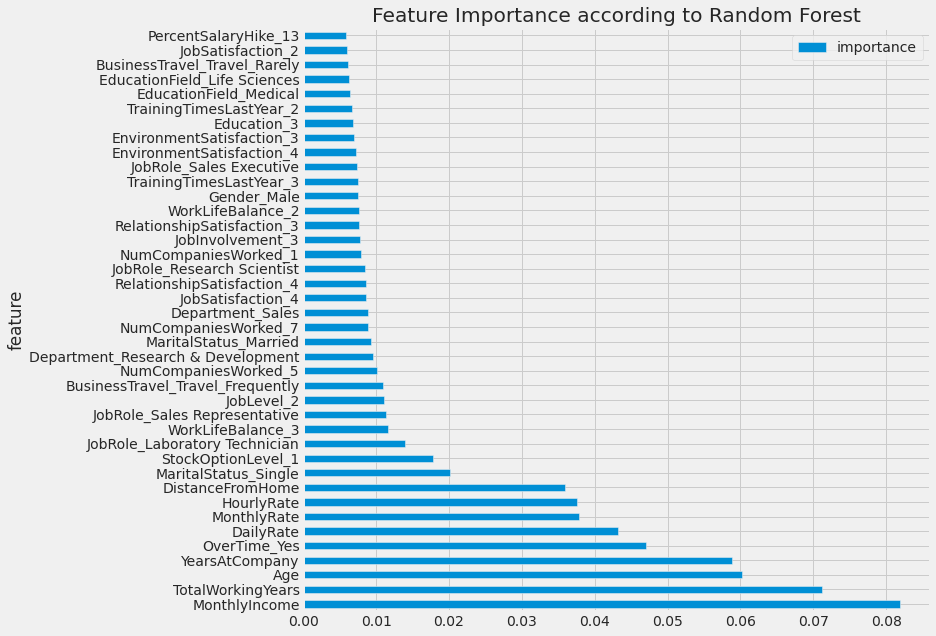
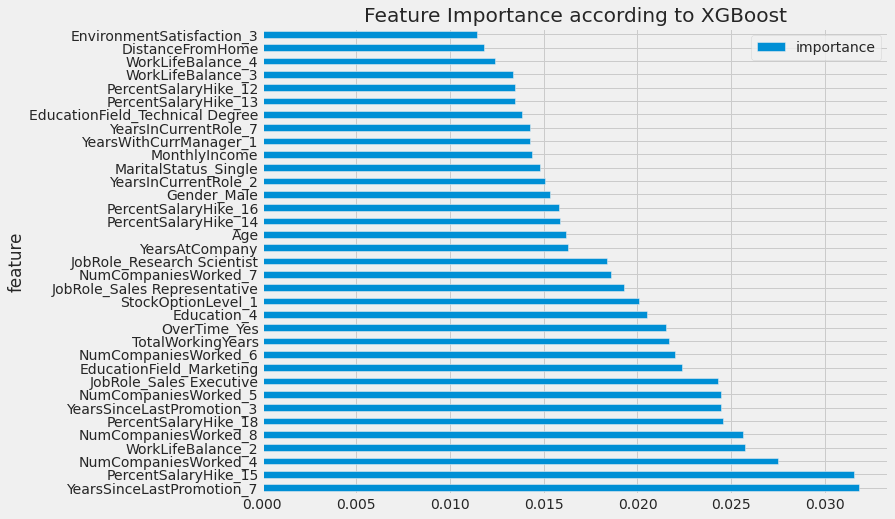
- The workers with low JobLevel, MonthlyIncome, YearAtCompany, and TotalWorkingYears are more likely to quit their jobs.
- BusinessTravel : The workers who travel a lot are more likely to quit than other employees.
- Department : The worker in Research & Development are more likely to stay than the workers in other departments.
- EducationField : The workers with Human Resources and Technical Degree are more likely to quit than employees from other fields of education.
- Gender : The Male are more likely to quit.
- JobRole : The workers in Laboratory Technician, Sales Representative, and Human Resources are more likely to quit the workers in other positions.
- MaritalStatus : The workers who have Single marital status are more likely to quit the Married, and Divorced.
- OverTime : The workers who work more hours are more likely to quit than others.
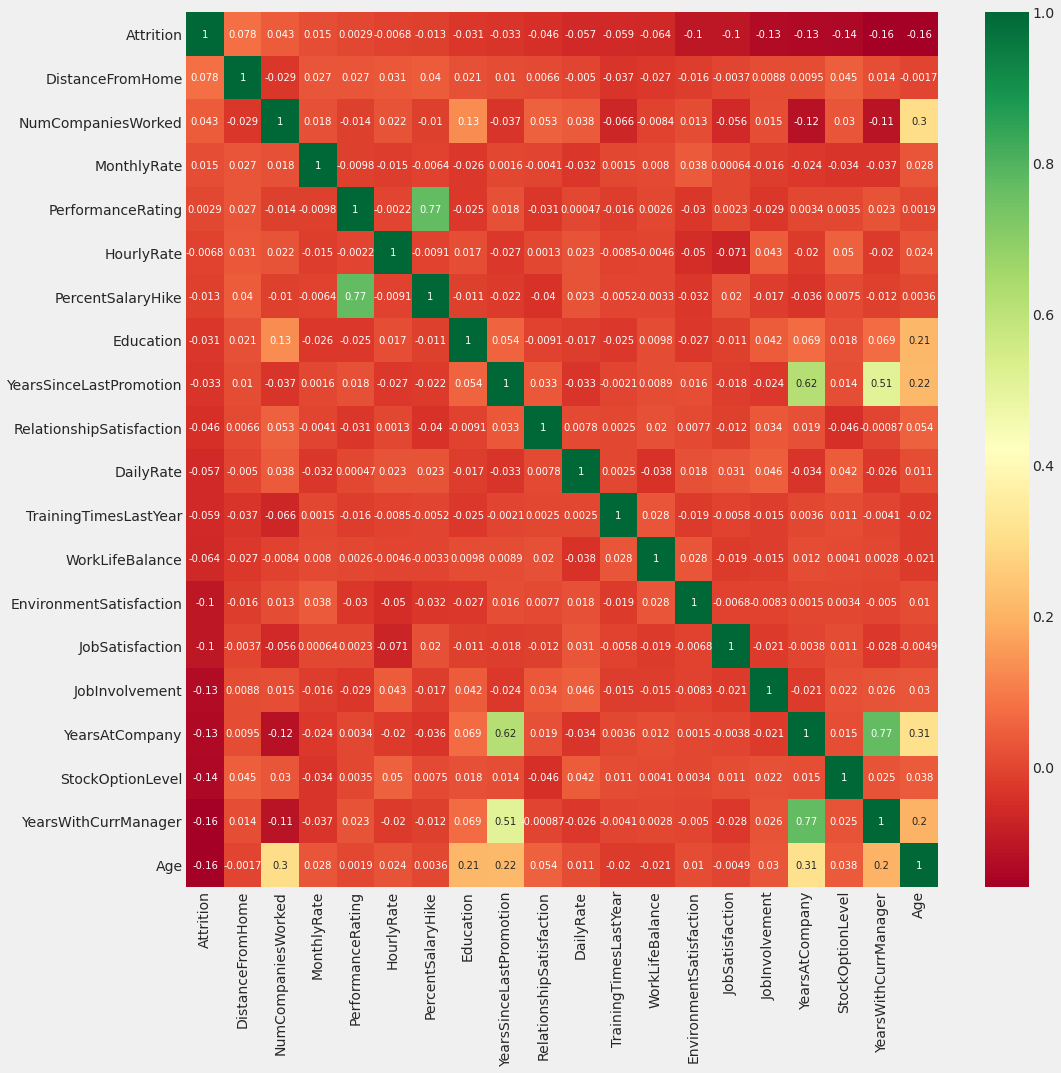
Correlation Matrix
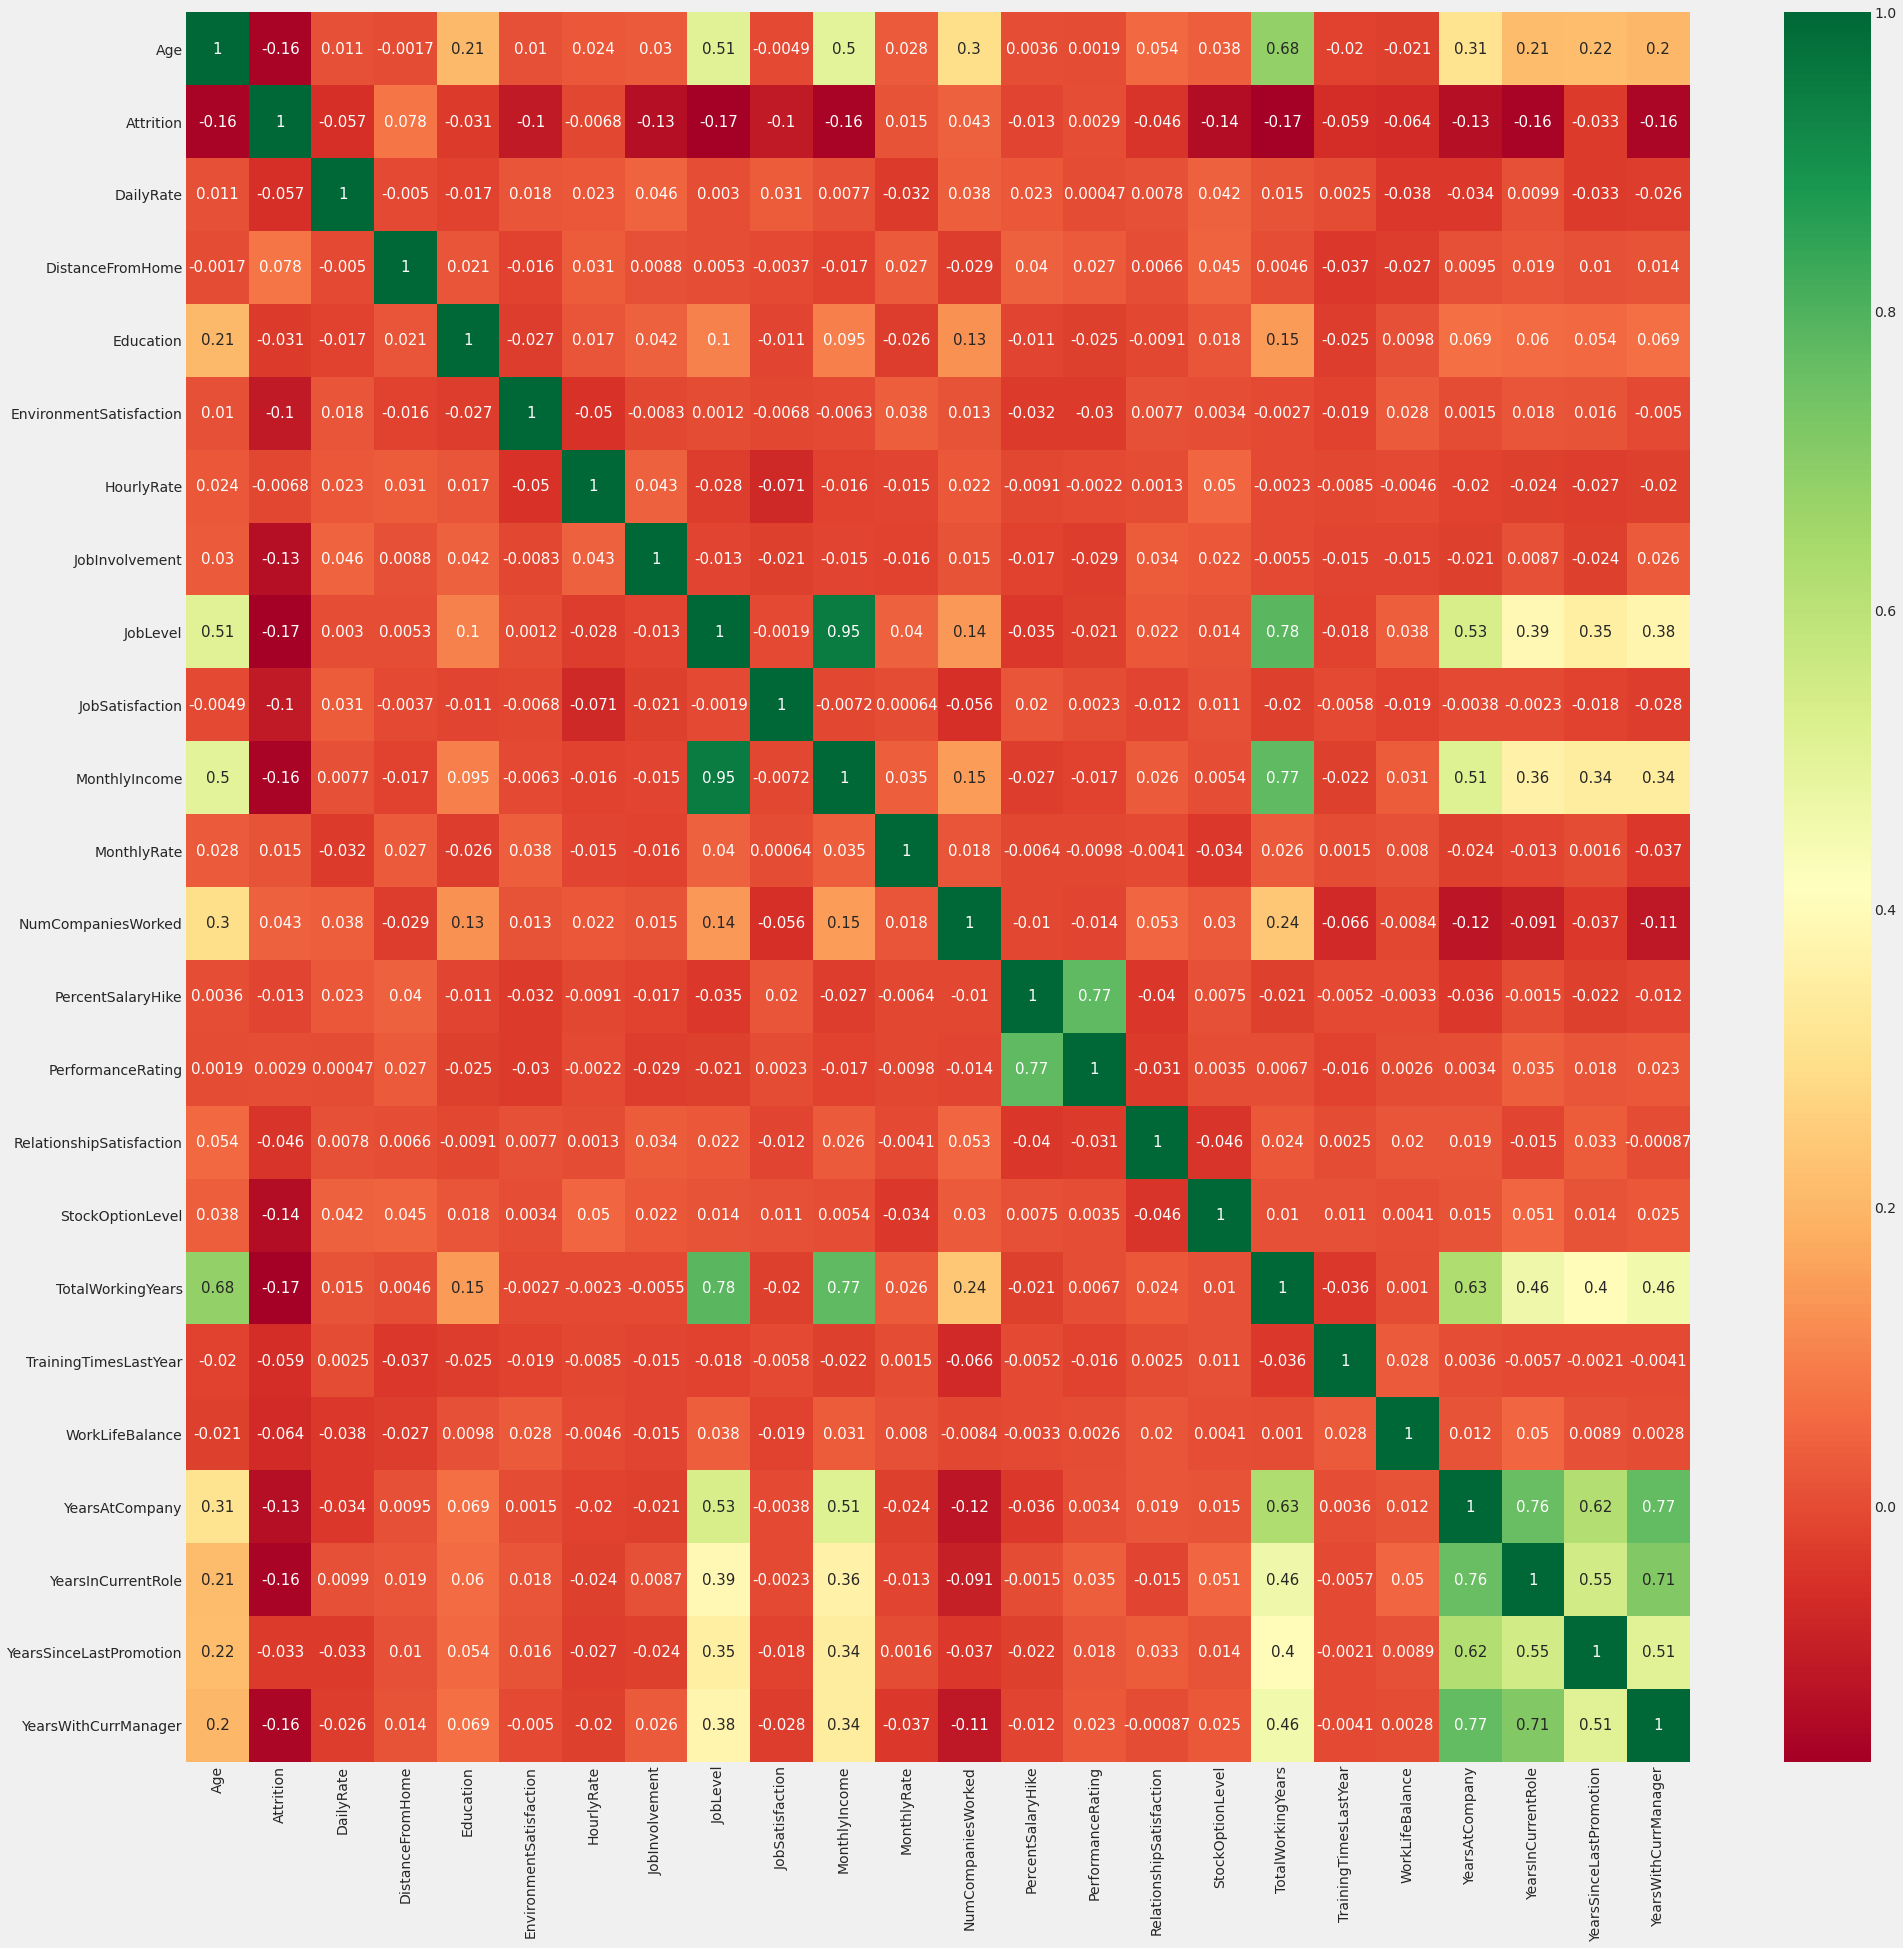
Analysis of correlation results (sample analysis):
- Monthly income is highly correlated with Job level.
- The job level is highly correlated with total working hours.
- Monthly income is highly correlated with total working hours.
- Age is also positively correlated with total working hours.
- Marital status and stock options level are negatively correlated
Data Processing
Converting categorical features to machine-readable data
<class 'pandas.core.frame.DataFrame'>
RangeIndex: 1470 entries, 0 to 1469
Columns: 136 entries, Age to YearsWithCurrManager_17
dtypes: int64(9), uint8(127)
memory usage: 285.8 KB
Checking for duplicate records and features
(1470, 136)
(1470, 136)
92
Applying machine learning algorithms
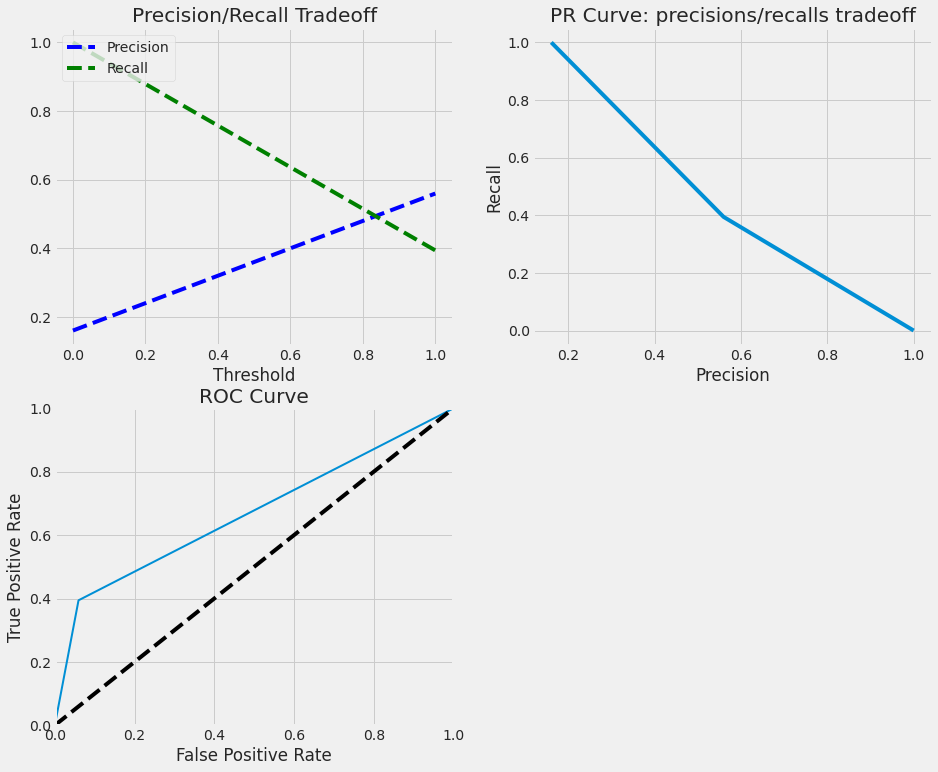
What defines success?
0.8390022675736961
We have imbalanced data, so if we predict that all our employees will stay we’ll have an accuracy of 83.90%.
===============TRAIN=================
Staying Rate: 83.87%
Leaving Rate: 16.13%
===============TEST=================
Staying Rate: 83.90%
Leaving Rate: 16.10%
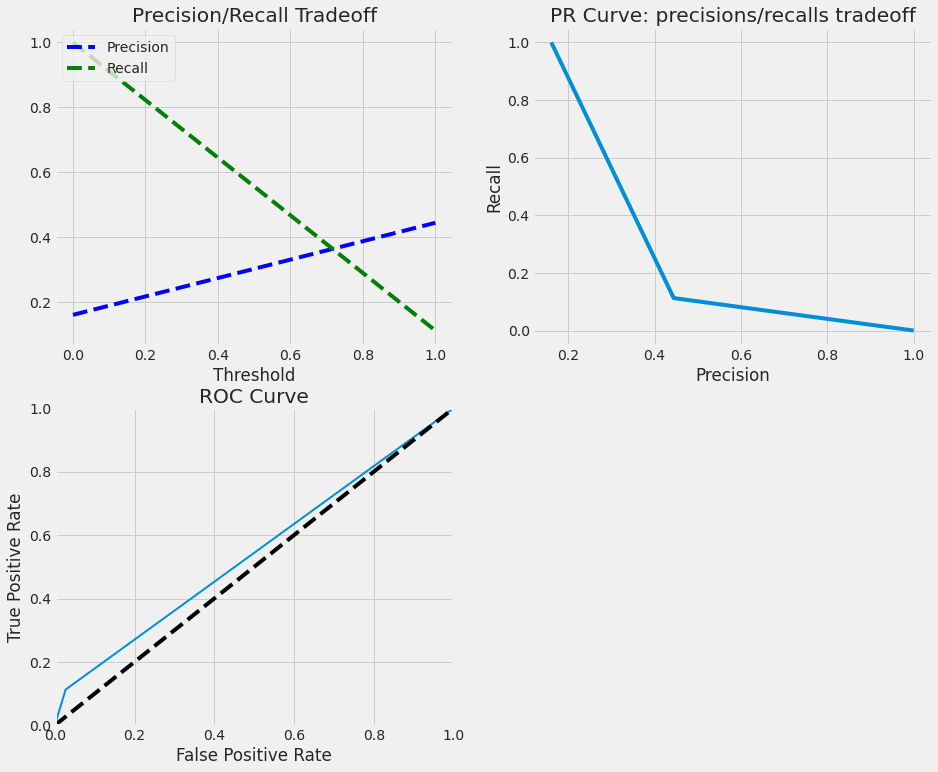
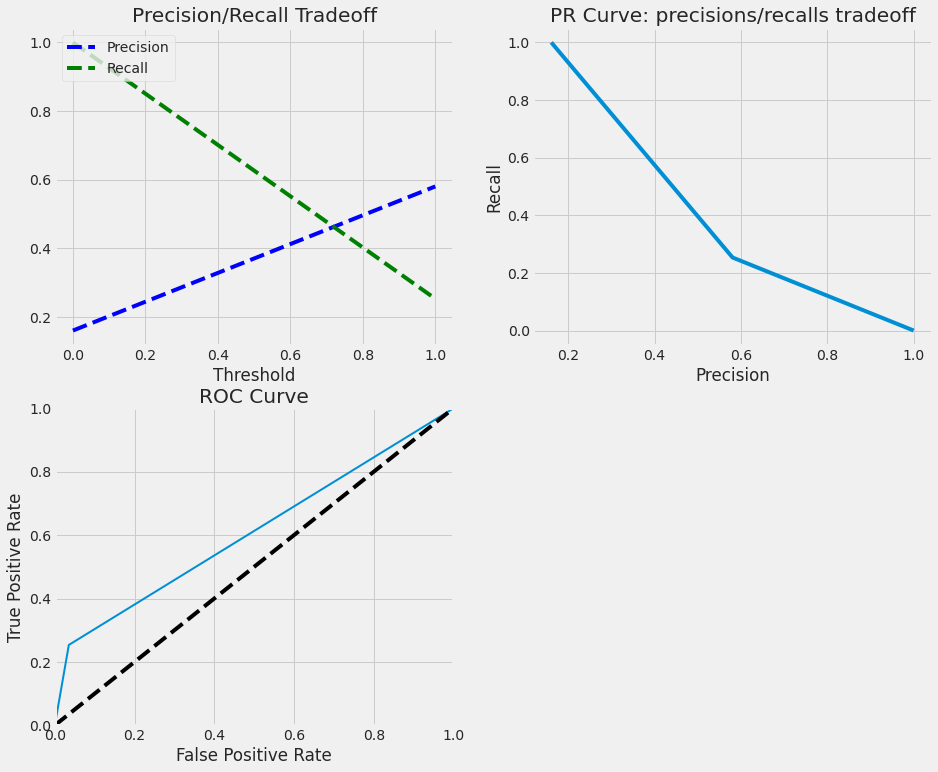
Logistic Regression
TRAINIG RESULTS:
===============================
CONFUSION MATRIX:
[[849  14]
 [ 59 107]]
ACCURACY SCORE:
0.9291
CLASSIFICATION REPORT:
               0      1  accuracy  macro avg  weighted avg
precision   0.94   0.88      0.93       0.91          0.93
recall      0.98   0.64      0.93       0.81          0.93
f1-score    0.96   0.75      0.93       0.85          0.92
support   863.00 166.00      0.93    1029.00       1029.00
TESTING RESULTS:
===============================
CONFUSION MATRIX:
[[348  22]
 [ 43  28]]
ACCURACY SCORE:
0.8526
CLASSIFICATION REPORT:
               0     1  accuracy  macro avg  weighted avg
precision   0.89  0.56      0.85       0.73          0.84
recall      0.94  0.39      0.85       0.67          0.85
f1-score    0.91  0.46      0.85       0.69          0.84
support   370.00 71.00      0.85     441.00        441.00
Random Forest Classifier
TRAINIG RESULTS:
===============================
CONFUSION MATRIX:
[[863   0]
 [  0 166]]
ACCURACY SCORE:
1.0000
CLASSIFICATION REPORT:
               0      1  accuracy  macro avg  weighted avg
precision   1.00   1.00      1.00       1.00          1.00
recall      1.00   1.00      1.00       1.00          1.00
f1-score    1.00   1.00      1.00       1.00          1.00
support   863.00 166.00      1.00    1029.00       1029.00
TESTING RESULTS:
===============================
CONFUSION MATRIX:
[[362   8]
 [ 63   8]]
ACCURACY SCORE:
0.8390
CLASSIFICATION REPORT:
               0     1  accuracy  macro avg  weighted avg
precision   0.85  0.50      0.84       0.68          0.80
recall      0.98  0.11      0.84       0.55          0.84
f1-score    0.91  0.18      0.84       0.55          0.79
support   370.00 71.00      0.84     441.00        441.00
Fitting 5 folds for each of 648 candidates, totalling 3240 fits
[Parallel(n_jobs=-1)]: Using backend LokyBackend with 4 concurrent workers.
[Parallel(n_jobs=-1)]: Done  42 tasks      | elapsed:   16.8s
[Parallel(n_jobs=-1)]: Done 192 tasks      | elapsed:  1.1min
[Parallel(n_jobs=-1)]: Done 442 tasks      | elapsed:  2.6min
[Parallel(n_jobs=-1)]: Done 792 tasks      | elapsed:  4.8min
[Parallel(n_jobs=-1)]: Done 1242 tasks      | elapsed:  8.2min
[Parallel(n_jobs=-1)]: Done 1792 tasks      | elapsed: 11.8min
[Parallel(n_jobs=-1)]: Done 2442 tasks      | elapsed: 15.3min
[Parallel(n_jobs=-1)]: Done 3192 tasks      | elapsed: 20.9min
[Parallel(n_jobs=-1)]: Done 3240 out of 3240 | elapsed: 21.3min finished
TRAINIG RESULTS:
===============================
CONFUSION MATRIX:
[[863   0]
 [ 15 151]]
ACCURACY SCORE:
0.9854
CLASSIFICATION REPORT:
               0      1  accuracy  macro avg  weighted avg
precision   0.98   1.00      0.99       0.99          0.99
recall      1.00   0.91      0.99       0.95          0.99
f1-score    0.99   0.95      0.99       0.97          0.99
support   863.00 166.00      0.99    1029.00       1029.00
TESTING RESULTS:
===============================
CONFUSION MATRIX:
[[360  10]
 [ 63   8]]
ACCURACY SCORE:
0.8345
CLASSIFICATION REPORT:
               0     1  accuracy  macro avg  weighted avg
precision   0.85  0.44      0.83       0.65          0.79
recall      0.97  0.11      0.83       0.54          0.83
f1-score    0.91  0.18      0.83       0.54          0.79
support   370.00 71.00      0.83     441.00        441.00
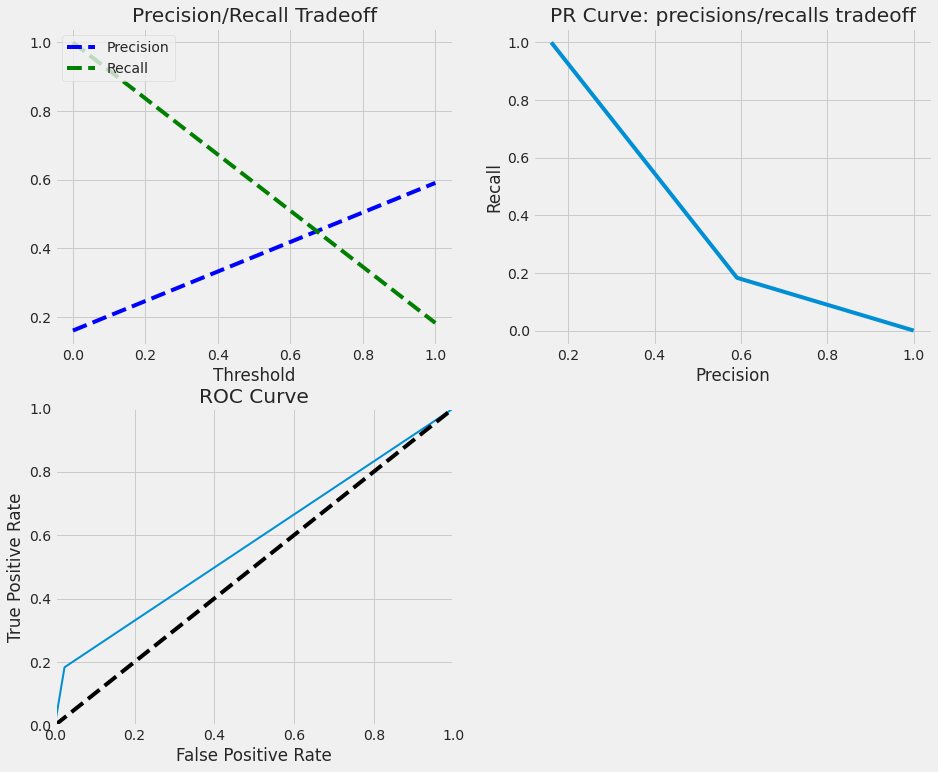
Support Vector Machine
TRAINIG RESULTS:
===============================
CONFUSION MATRIX:
[[855   8]
 [ 47 119]]
ACCURACY SCORE:
0.9466
CLASSIFICATION REPORT:
               0      1  accuracy  macro avg  weighted avg
precision   0.95   0.94      0.95       0.94          0.95
recall      0.99   0.72      0.95       0.85          0.95
f1-score    0.97   0.81      0.95       0.89          0.94
support   863.00 166.00      0.95    1029.00       1029.00
TESTING RESULTS:
===============================
CONFUSION MATRIX:
[[345  25]
 [ 44  27]]
ACCURACY SCORE:
0.8435
CLASSIFICATION REPORT:
               0     1  accuracy  macro avg  weighted avg
precision   0.89  0.52      0.84       0.70          0.83
recall      0.93  0.38      0.84       0.66          0.84
f1-score    0.91  0.44      0.84       0.67          0.83
support   370.00 71.00      0.84     441.00        441.00
Fitting 3 folds for each of 12 candidates, totalling 36 fits
[Parallel(n_jobs=1)]: Using backend SequentialBackend with 1 concurrent workers.
[Parallel(n_jobs=1)]: Done  36 out of  36 | elapsed:  6.6min finished
GridSearchCV(cv=3, estimator=SVC(random_state=42),
             param_grid=[{'C': [1, 10, 100, 1000], 'kernel':['linear']},
             {'C': [1, 10, 100, 1000], 'gamma': [0.001, 0.0001],
                          'kernel': ['rbf']}],
             scoring='roc_auc', verbose=1)
TRAINIG RESULTS:
===============================
CONFUSION MATRIX:
[[862   1]
 [  6 160]]
ACCURACY SCORE:
0.9932
CLASSIFICATION REPORT:
               0      1  accuracy  macro avg  weighted avg
precision   0.99   0.99      0.99       0.99          0.99
recall      1.00   0.96      0.99       0.98          0.99
f1-score    1.00   0.98      0.99       0.99          0.99
support   863.00 166.00      0.99    1029.00       1029.00
TESTING RESULTS:
===============================
CONFUSION MATRIX:
[[346  24]
 [ 42  29]]
ACCURACY SCORE:
0.8503
CLASSIFICATION REPORT:
               0     1  accuracy  macro avg  weighted avg
precision   0.89  0.55      0.85       0.72          0.84
recall      0.94  0.41      0.85       0.67          0.85
f1-score    0.91  0.47      0.85       0.69          0.84
support   370.00 71.00      0.85     441.00        441.00

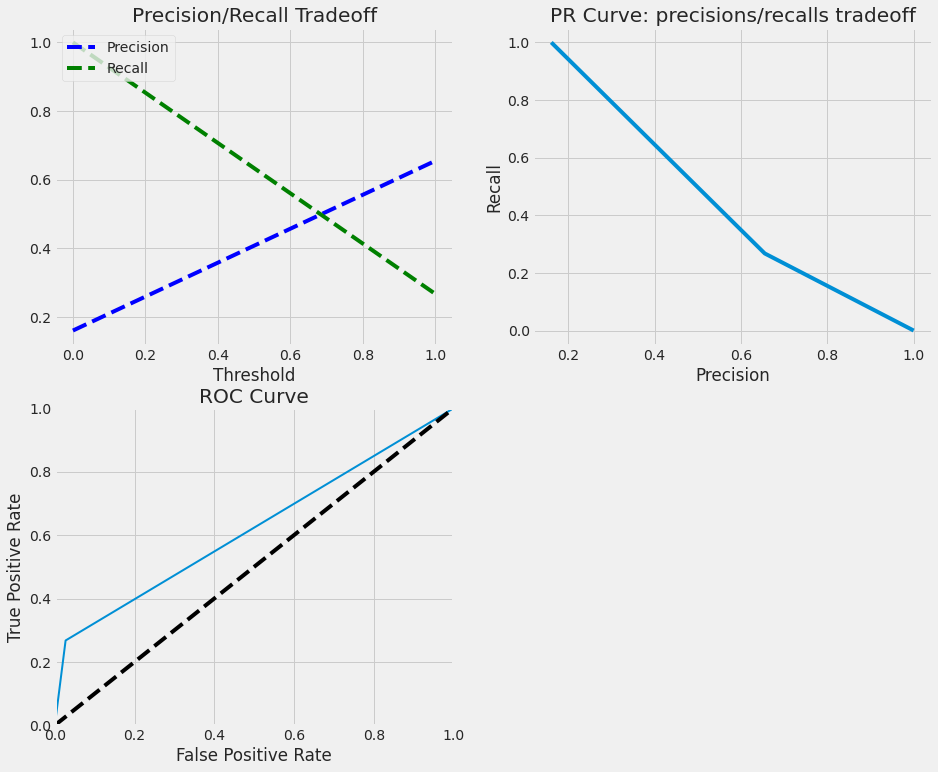
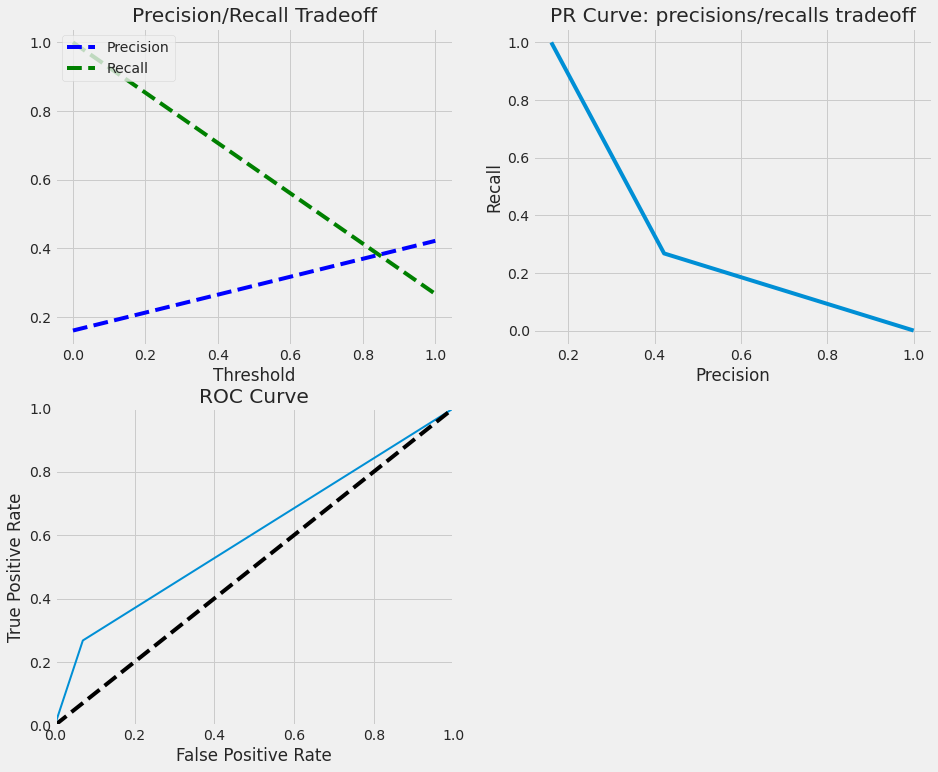
XGBoost Classifier
TRAINIG RESULTS:
===============================
CONFUSION MATRIX:
[[863   0]
 [  0 166]]
ACCURACY SCORE:
1.0000
CLASSIFICATION REPORT:
               0      1  accuracy  macro avg  weighted avg
precision   1.00   1.00      1.00       1.00          1.00
recall      1.00   1.00      1.00       1.00          1.00
f1-score    1.00   1.00      1.00       1.00          1.00
support   863.00 166.00      1.00    1029.00       1029.00
TESTING RESULTS:
===============================
CONFUSION MATRIX:
[[360  10]
 [ 52  19]]
ACCURACY SCORE:
0.8594
CLASSIFICATION REPORT:
               0     1  accuracy  macro avg  weighted avg
precision   0.87  0.66      0.86       0.76          0.84
recall      0.97  0.27      0.86       0.62          0.86
f1-score    0.92  0.38      0.86       0.65          0.83
support   370.00 71.00      0.86     441.00        441.00
LightGBM
TRAINIG RESULTS:
===============================
CONFUSION MATRIX:
[[863   0]
 [  0 166]]
ACCURACY SCORE:
1.0000
CLASSIFICATION REPORT:
               0      1  accuracy  macro avg  weighted avg
precision   1.00   1.00      1.00       1.00          1.00
recall      1.00   1.00      1.00       1.00          1.00
f1-score    1.00   1.00      1.00       1.00          1.00
support   863.00 166.00      1.00    1029.00       1029.00
TESTING RESULTS:
===============================
CONFUSION MATRIX:
[[357  13]
 [ 53  18]]
ACCURACY SCORE:
0.8503
CLASSIFICATION REPORT:
               0     1  accuracy  macro avg  weighted avg
precision   0.87  0.58      0.85       0.73          0.82
recall      0.96  0.25      0.85       0.61          0.85
f1-score    0.92  0.35      0.85       0.63          0.82
support   370.00 71.00      0.85     441.00        441.00
CatBoost
TRAINIG RESULTS:
===============================
CONFUSION MATRIX:
[[863   0]
 [ 17 149]]
ACCURACY SCORE:
0.9835
CLASSIFICATION REPORT:
               0      1  accuracy  macro avg  weighted avg
precision   0.98   1.00      0.98       0.99          0.98
recall      1.00   0.90      0.98       0.95          0.98
f1-score    0.99   0.95      0.98       0.97          0.98
support   863.00 166.00      0.98    1029.00       1029.00
TESTING RESULTS:
===============================
CONFUSION MATRIX:
[[361   9]
 [ 58  13]]
ACCURACY SCORE:
0.8481
CLASSIFICATION REPORT:
               0     1  accuracy  macro avg  weighted avg
precision   0.86  0.59      0.85       0.73          0.82
recall      0.98  0.18      0.85       0.58          0.85
f1-score    0.92  0.28      0.85       0.60          0.81
support   370.00 71.00      0.85     441.00        441.00
AdaBoost
TRAINIG RESULTS:
===============================
CONFUSION MATRIX:
[[843  20]
 [ 88  78]]
ACCURACY SCORE:
0.8950
CLASSIFICATION REPORT:
               0      1  accuracy  macro avg  weighted avg
precision   0.91   0.80      0.90       0.85          0.89
recall      0.98   0.47      0.90       0.72          0.90
f1-score    0.94   0.59      0.90       0.77          0.88
support   863.00 166.00      0.90    1029.00       1029.00
TESTING RESULTS:
===============================
CONFUSION MATRIX:
[[344  26]
 [ 52  19]]
ACCURACY SCORE:
0.8231
CLASSIFICATION REPORT:
               0     1  accuracy  macro avg  weighted avg
precision   0.87  0.42      0.82       0.65          0.80
recall      0.93  0.27      0.82       0.60          0.82
f1-score    0.90  0.33      0.82       0.61          0.81
support   370.00 71.00      0.82     441.00        441.00
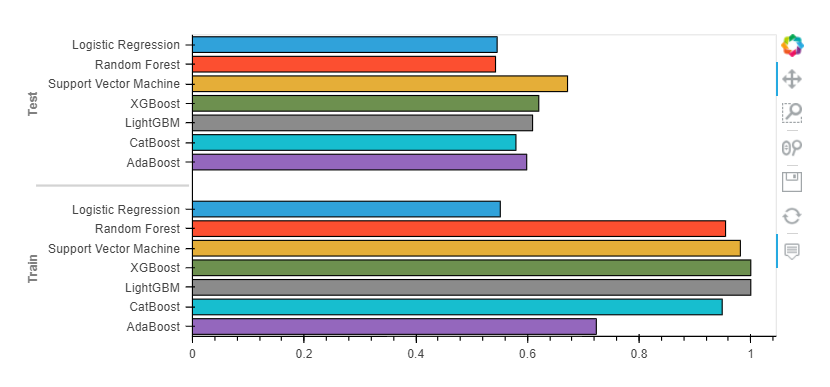
Comparing Models Performance
RANDOM FOREST                  roc_auc_score: 0.543
XGBOOST                        roc_auc_score: 0.620
LOGISTIC REGRESSION            roc_auc_score: 0.546
SUPPORT VECTOR MACHINE         roc_auc_score: 0.500
LIGHTGBM                       roc_auc_score: 0.609
CATBOOST                       roc_auc_score: 0.579
ADABOOST                       roc_auc_score: 0.599
Conclusion
In this article, we learned how to develop a machine-learning model to predict employee attrition. We used a variety of ML algorithms, including ANNs and Tree-Based models. The models tend to overfit the training data because of the problem's complexity and the small amount of data.
Machine Learning Project in Python Step-By-Step — Predicting Employee Attrition was originally published in Towards AI on Medium, where people are continuing the conversation by highlighting and responding to this story.
Join thousands of data leaders on the AI newsletter. Join over 80,000 subscribers and keep up to date with the latest developments in AI. From research to projects and ideas. If you are building an AI startup, an AI-related product, or a service, we invite you to consider becoming a sponsor.
Published via Towards AI
Towards AI Academy
We Build Enterprise-Grade AI. We'll Teach You to Master It Too.
15 engineers. 100,000+ students. Towards AI Academy teaches what actually survives production.
Start free — no commitment:
→ 6-Day Agentic AI Engineering Email Guide — one practical lesson per day
→ Agents Architecture Cheatsheet — 3 years of architecture decisions in 6 pages
Our courses:
→ AI Engineering Certification — 90+ lessons from project selection to deployed product. The most comprehensive practical LLM course out there.
→ Agent Engineering Course — Hands on with production agent architectures, memory, routing, and eval frameworks — built from real enterprise engagements.
→ AI for Work — Understand, evaluate, and apply AI for complex work tasks.
Note: Article content contains the views of the contributing authors and not Towards AI.
Related posts
Recent Posts


")

