


Beware the Black Swan
Last Updated on December 7, 2022 by Editorial Team
Author(s): Arslan Shahid
Originally published on Towards AI the World’s Leading AI and Technology News and Media Company. If you are building an AI-related product or service, we invite you to consider becoming an AI sponsor. At Towards AI, we help scale AI and technology startups. Let us help you unleash your technology to the masses.
What Nassim Nicholas Taleb’s book on probability & randomness can teach data professionals
Nassim Taleb is a former financial derivatives trader and probability researcher, his book ‘The Black Swan: The Impact of the Highly Improbable’ highlights how highly improbable events impact our daily life and financial markets. Unsurprisingly, it has plenty of lessons for data professionals since quantitative finance and data science both involve statistical models and probability theory.
What is a black swan?
Black Swan is a metaphor for a highly improbable yet very impactful event. According to Nassim, our models never seem to properly prepare for such events, despite the wizardry we employ in developing them. The Covid — 19 outbreak is perhaps the most recent example of an unforeseen event that no one saw coming yet had a devastating impact on everyday life. For financial markets, the 2008 financial crisis was a black swan that led to the bankruptcy of Lehman Brothers and a global recession.
Black swans don’t necessarily have to be destructive. The discovery of oil in the north sea of Norway could be thought of as a black swan. As the story goes nobody believed there to be huge oil reserves when Norway asserted rights to the North Sea. Another ‘positive’ black swan could be the invention of lasers, when developed it had no real purpose but over time applications were discovered like curing eyesight. In both these cases, the serendipitous outcome was unforeseen (highly improbable) yet very impactful.
The Triplet of Opacity
Nassim states three errors humans make when evaluating historical events:
- The illusion of understanding: We think we know what caused what, but all our explanations could be fictitious. Giving the illusion that we can predict and explain events when in reality, they could be unpredictable.
- The retrospective distortion: We come up with explanations, solutions, and precautions after the fact. Giving the illusion that the negative Black Swan could have been mitigated.
- The overvaluation of factual information: We do not realize what appears ‘factual’ could be a distortion or incomplete.
What does this mean for the data professional?
Some things are not predictable or explainable. If they are explainable the explanation usually comes after the problem not before, warning us that they are unforeseen events that are not captured in the data and therefore our models are blind. The last point pertains to inferences drawn from models, what we believe to be a factual representation of relationships in our datasets could be biased estimates drawn from ‘incomplete’ samples.
The Narrative Fallacy
As humans, we tend to construct stories and narratives when we observe random events. Our minds are susceptible to making inferences without proper evidence.
Consider the following scenario, you’re a data analyst working for a high-rise apartment realtor. You are assigned to ascertain the following question, how much space should they allocate for parking in their new development project?
Here is a graph depicting the relationship between rents & parking space:
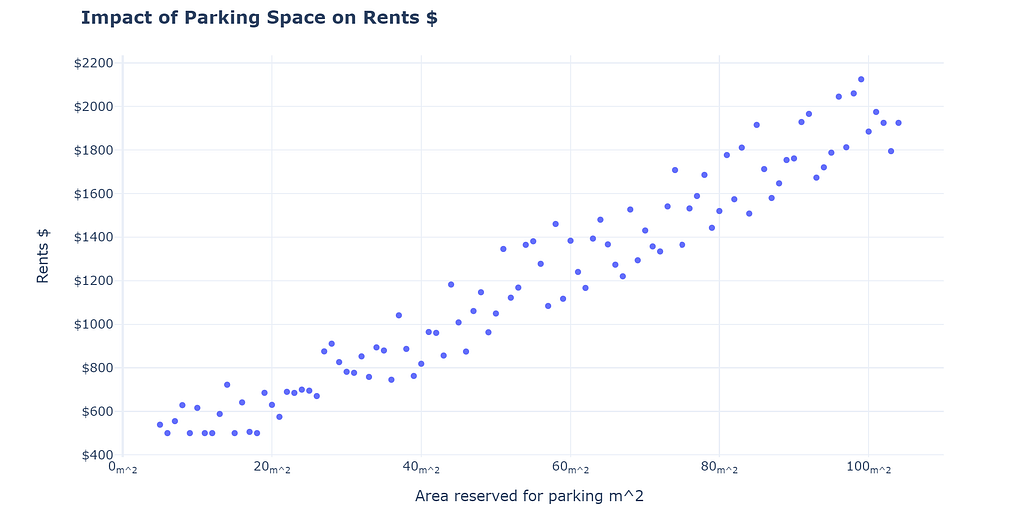
As a data professional you see the above chart, what conclusion do you make? If they have 1000 m² for the whole project, how much should they allot for parking? It is easy to construct a narrative that parking is a huge convenience for rentees. Therefore, allocating huge space would allow the realtor to charge more rent! Seems reasonable?
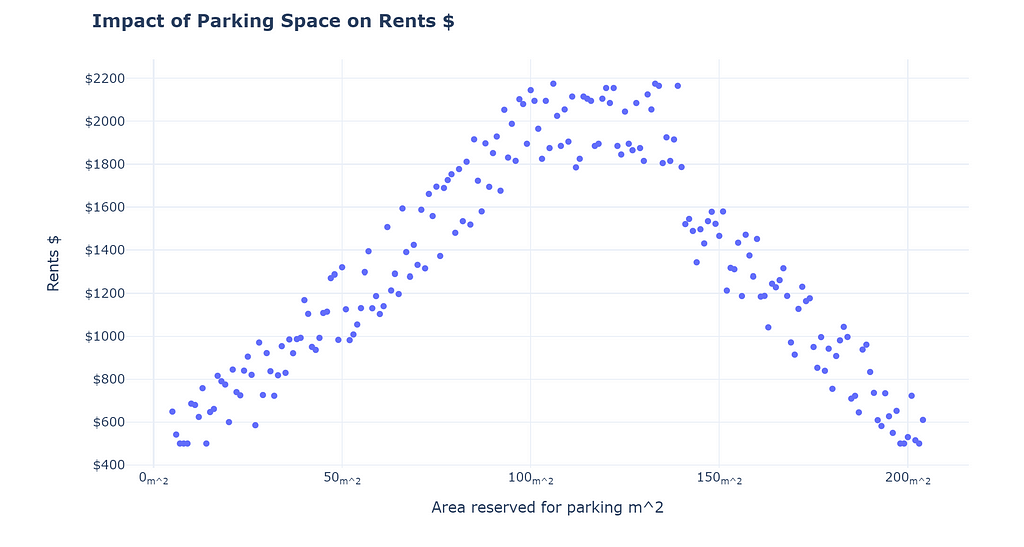
The aforementioned line of reasoning is not necessarily false, but it has the problem of falling for the narrative fallacy. The truth is that by only viewing the data provided to us thus far we cannot ascertain a causal relationship. There are hundreds of other explanations which we can construct to explain what we observe. For example, you can argue that the realtor is involved in both large and small construction projects, large construction projects yield higher rents and also have more space for parking. Therefore no impact of parking space on rents.
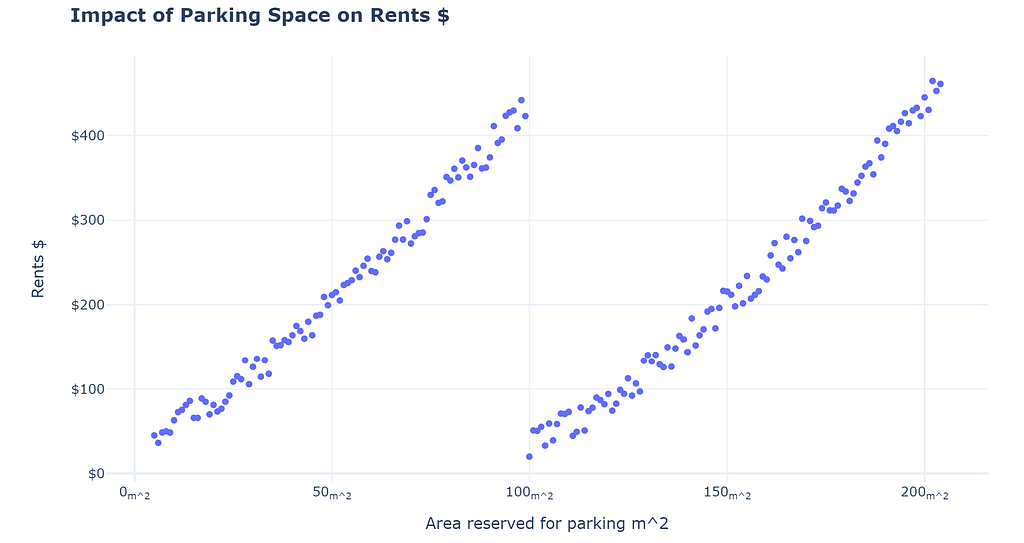
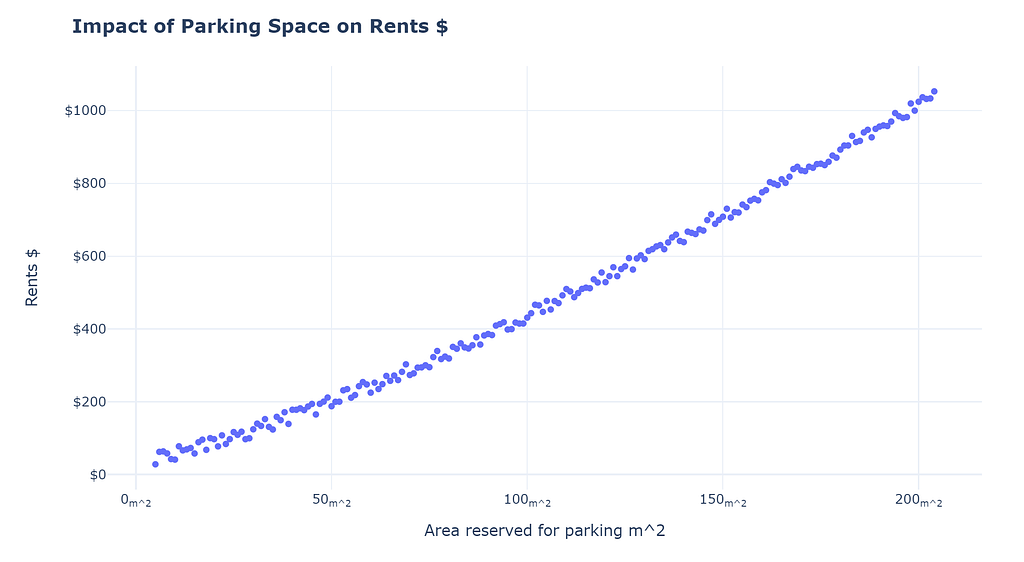
Which is the true way to interpret the data? It requires adding controls and perhaps gathering more evidence.
I know what you must be thinking, this is absurd! Of course, things are not ever going to be perfect doesn’t mean we should not answer, or does it?
No, that is not the main point. The main point is to be skeptical! We as humans construct stories to explain what we observe; as data professionals, we should resist our urge to construct narratives (without concrete evidence). We should never try to make inferences beyond what we observe or be careful of the risks if we do. We should always be on the lookout for falsifying our narratives. Story-telling might be good for selling, but it also perpetuates self-delusion!
Enjoying this story? Need coding help? Please consider becoming a patron! (The medium partner program is unavailable in my country, Patreon is the only way to monetize my writing)
Arslan Shahid is creating Blogs | Patreon
The Ludic Fallacy
Nassim originated the name for this fallacy. He points out that academic experts have constructed models that do not fit reality, yet we persist in using them. He points in particular to how the modern portfolio theory and the improper use of the gaussian distribution have led the modern-day financial analyst to underestimate the risk of black swan events.
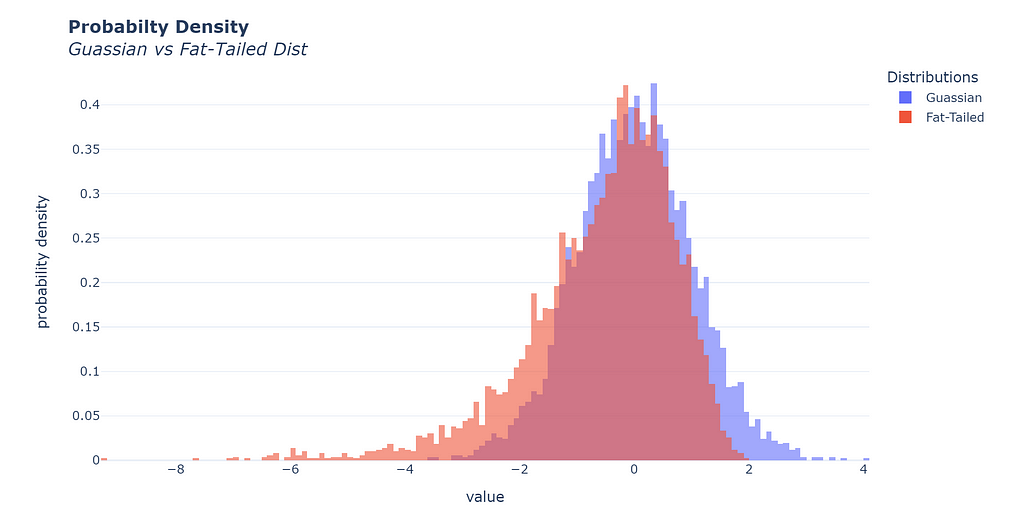
Improbable events might be more likely than we think!
Nassim elaborates that the distribution of returns in the stock market is not gaussian and instead follows the fat-tailed distribution that makes extreme events more likely than the gaussian model leads us to believe, which in turn causes options traders to overleverage or overexpose their portfolio to the downside risk.
As data professionals, we have all been accustomed to a set of methods and distributions that make our lives easier. Most linear models follow the errors to be normally distributed (Gaussian), however, nature or whatever we choose to model is under no obligation to be gaussian. The ludic fallacy extends beyond just a distribution; any mathematical construct we use can subject us to the fallacy.
The thing to care about is how much we can afford to rely on these simplifications. The proliferation of data tools and techniques has made us more susceptible to accepting wrong answers as truth! Just because a well-renowned method estimates or predicts something does not make it true. It is only as true as the data and assumptions of the model allow it to be.
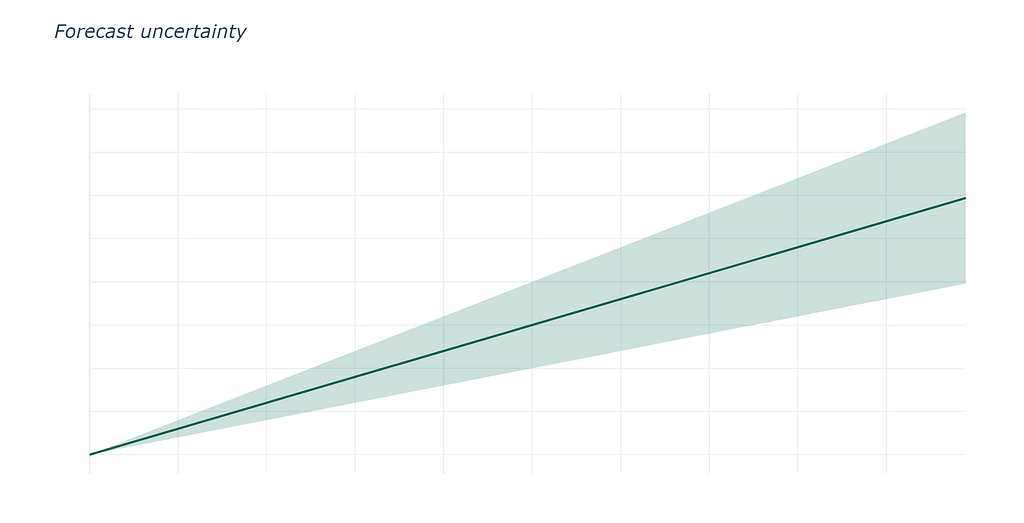
Forecasts are not facts!
This one is obvious when pointed out, but yet we take forecasts more seriously now than ever. In most cases they are innocuous, making a wrong forecast of sales for your business will not be catastrophic in most cases. However, there has been a rise in AI businesses trying to disrupt traditional industries, like Opendoor, trying to disrupt the housing market. Their whole business model relies on their algorithm’s ability to forecast the price of houses and to give customers an accurate prediction of the value of their houses.
Some things are very easy to forecast, but most things about social sciences, such as economics, are not. Especially when there is human behavior involved. Economists are notoriously wrong, yet we continue to rely on their predictions.
More and more businesses are relying on predictions and forecasts to make money. Nassim highlights that the world is chaotic. Therefore, small changes in our inputs can cause huge changes in outputs. No matter the wizardry used, chaos, by definition, cannot be predicted. Forecasts and predictions lose power the more you extend them through time.
The key takeaway is this, the more you rely on predictions, the higher the chance of systemic failure since if one model churns out wrong predictions, it can cause other systems to malfunction. The more we rely on models, the more risks we are introducing into the system.
Thank you for reading! If you enjoy what I write, please follow and also subscribe to get an email whenever I publish!
Here are some of my posts that you might like:
- Why AI Fairness Is Important in Telecom Personalization
- Money Balling Cricket — Probability of 100 using repeated conditioning
- Make Your Matplotlib Plots Stand Out Using This Cheat Sheet
Beware the Black Swan was originally published in Towards AI on Medium, where people are continuing the conversation by highlighting and responding to this story.
Join thousands of data leaders on the AI newsletter. It’s free, we don’t spam, and we never share your email address. Keep up to date with the latest work in AI. From research to projects and ideas. If you are building an AI startup, an AI-related product, or a service, we invite you to consider becoming a sponsor.
Published via Towards AI
Towards AI Academy
We Build Enterprise-Grade AI. We'll Teach You to Master It Too.
15 engineers. 100,000+ students. Towards AI Academy teaches what actually survives production.
Start free — no commitment:
→ 6-Day Agentic AI Engineering Email Guide — one practical lesson per day
→ Agents Architecture Cheatsheet — 3 years of architecture decisions in 6 pages
Our courses:
→ AI Engineering Certification — 90+ lessons from project selection to deployed product. The most comprehensive practical LLM course out there.
→ Agent Engineering Course — Hands on with production agent architectures, memory, routing, and eval frameworks — built from real enterprise engagements.
→ AI for Work — Understand, evaluate, and apply AI for complex work tasks.
Note: Article content contains the views of the contributing authors and not Towards AI.
Related posts
Recent Posts
")


")


