


5 Regression Metrics Explained in Just 5mins
Last Updated on July 5, 2022 by Editorial Team
Author(s): Gowtham S R
Originally published on Towards AI the World’s Leading AI and Technology News and Media Company. If you are building an AI-related product or service, we invite you to consider becoming an AI sponsor. At Towards AI, we help scale AI and technology startups. Let us help you unleash your technology to the masses.
What are the different regression metrics? Can the R2 score become 0? when will the R2 score become negative? what are the differences between MAE and MSE? What is the adjusted R2 score?
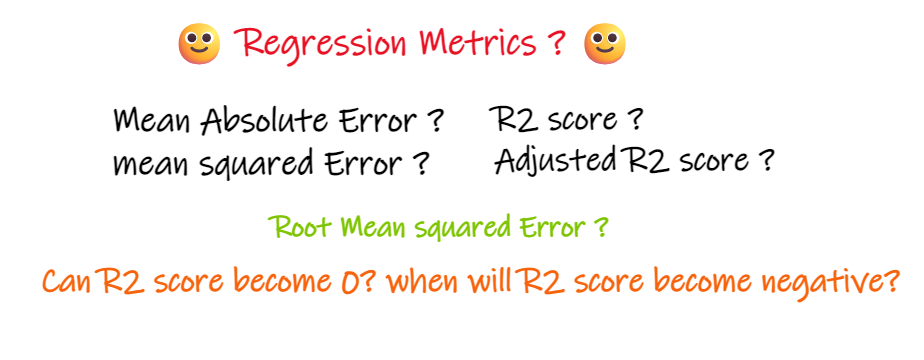
If you want to know the answers to the above questions then you are in the right place….
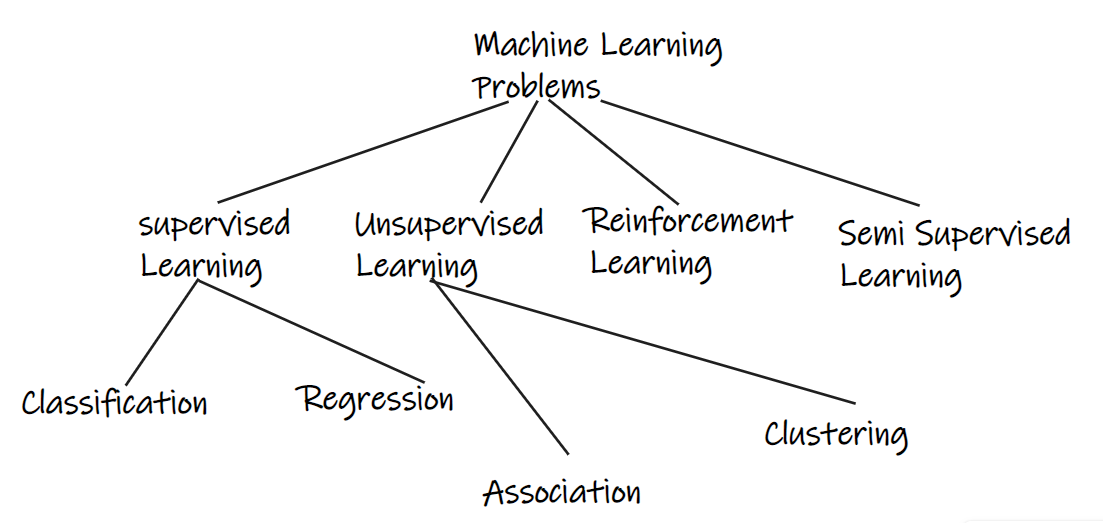
A regression problem is a type of supervised machine learning approach where the output variable is a real or continuous value, such as “salary” or “weight”. On the other hand, a classification problem is a type where the output will be categorical, such as predicting the output as “dog” or a “cat”.
In this article, we are discussing the regression metrics. Each of the metrics are having its own advantages and disadvantages….. For the classification metrics, you can read the classification metrics blog.
Consider a regression problem where the input is years of experience and the output is salary. The below image shows the linear regression line drawn to predict the salary.
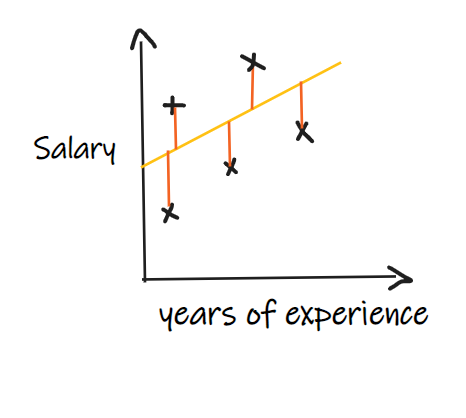
The actual and predicted values of salary show that the model is committing some errors, so with the help of a proper metric, we need to determine how good our model is….Let's discuss various commonly used regression metrics.
Mean Absolute Error(MAE):
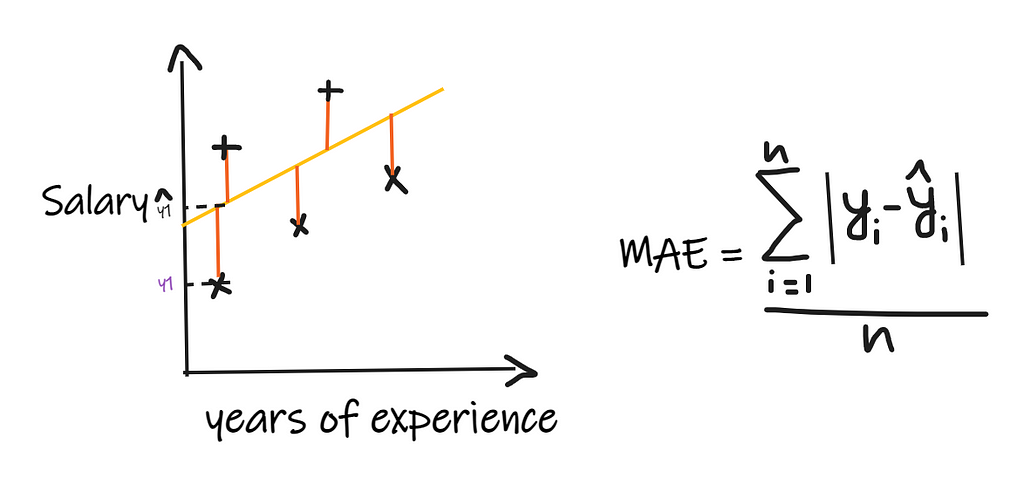
Mean Absolute Error(MAE) is the simplest regression metric. Here we take the difference between each of the actual and the predicted values and add them, and finally divide by the number of observations. For the regression model to be considered a good model, MAE should be as minimum as possible.
Advantages of MAE:
- Simple and easy to interpret. The result will have the same unit as that of the output. Eg: if the output column is having the unit LPA, then if the MAE comes to be 1.2, then we can interpret that the result is +1.2LPA or -1.2LPA
- MAE is comparatively robust to the outliers(When compared to some of the other regression metrics MAE is less affected by the outliers).
Disadvantages of MAE:
- MAE uses the modulus function, but the modulus function is not differentiable at all the points, so it can not be used as a loss function in many cases.
Mean Squared Error(MSE):
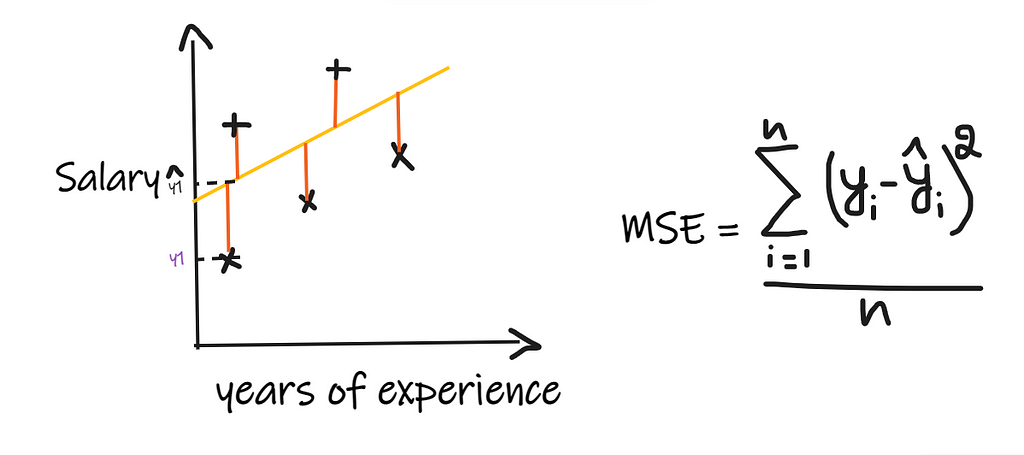
In Mean Squared Error(MSE) we take the difference between each of the actual and the predicted values then square the difference and add them and finally divide by the number of observations. For the regression model to be considered a good model, MSE should be as minimum as possible.
Advantages of MSE:
- The square function is differentiable at all the points and hence it can be used as a loss function.
The disadvantage of MSE:
- As the MSE uses the square function the result will have the unit which is a square of the output. So, it is difficult to interpret the result. The MSE will be having the unit LPA square.
- As it uses a square function, if there are outliers in the data, the difference gets squared, as a result, MSE is not robust to the outliers.
Root Mean Squared Error(RMSE):
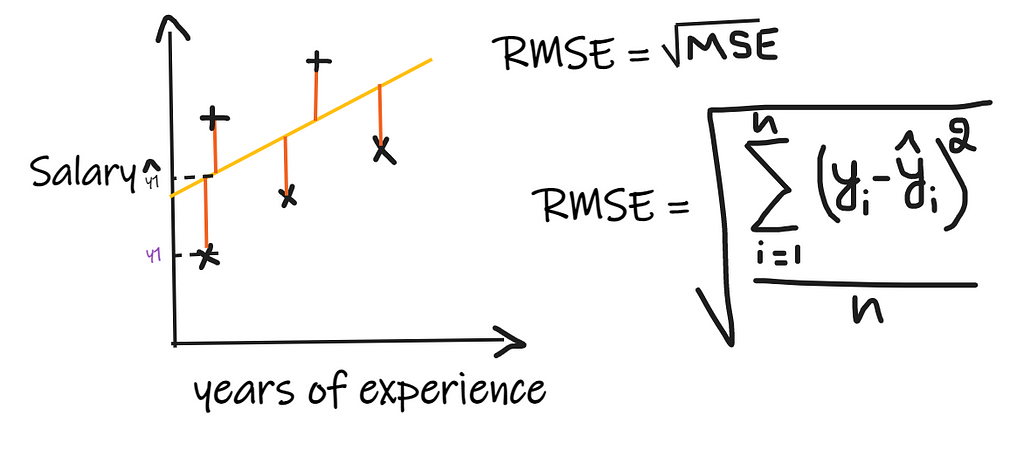
In Root Mean Squared Error(RMSE) we take the difference between each of the actual and the predicted values then square the difference and add them and finally divide by the number of observations. Then take the square root of the result. So, RMSE is nothing but the square root of MSE. For the regression model to be considered a good model, RMSE should be as minimum as possible.
Advantages and disadvantages of RMSE:
- It solves the problem of MSE, the unit will be the same as that of the output as it takes the square root, but still, it is not that robust to the outliers.
The above metrics depend on the context of the problem which we are solving, meaning there is a lot of difference if the MAE is 1.2 in terms of salary and in terms of centimeters. We cannot just say the model is good or bad by looking at the values of MAE, MSE, and RMSE without knowing the actual problem.
R2 score:
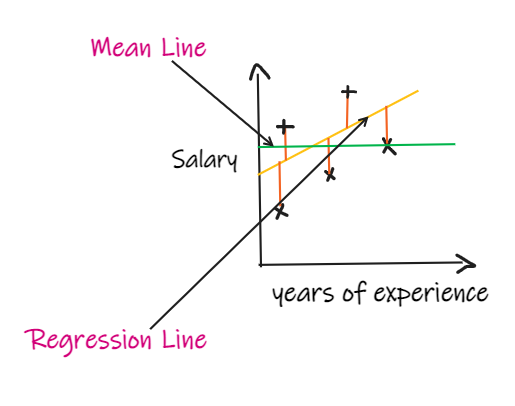
Consider that we do not have any input data, and if someone wants to know how much salary he can get in this company, then the best thing we can do is to give them the mean of the salary of all the employees.
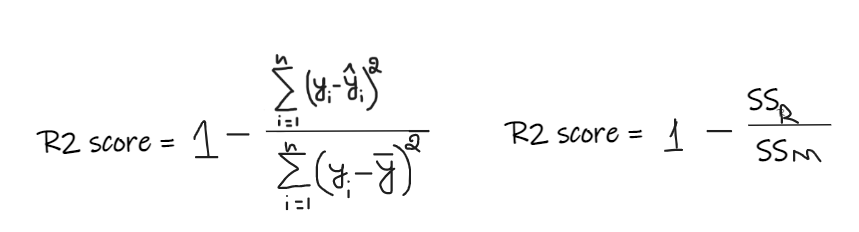
R2 score gives a value between 0 to 1, which can be interpreted for any context. It can be termed as the goodness of the fit.
SSR is the sum of squared error in the regression line and SSM is the Sum of squared error for the mean line. Here we are comparing the regression line with the mean line.
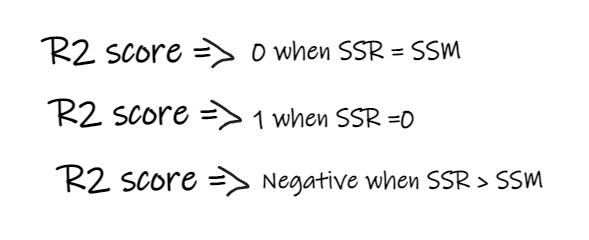
Some important points regarding the R2 score:
- If the R2 score is 0, that means our model is just as good as the mean line, so need to improve our model.
- If the R2 score is 1, then the right part of the equation is becoming 0, which can happen only when our model fits every data point and is not making any error which in practice is very difficult to achieve.
- If the R2 score is negative, it means that the right side of the equation is greater than 1 which can happen when SSR > SSM. Meaning our model is worst than the mean line.
R2 can also be interpreted as given below.
If the R2 score of our model comes out to be 0.8, that means we can say that our model is able to explain 80% of the variance of the output. i.e, 80% of the variation in the salary can be explained by the input (years of experience) , but the rest 20% is unknown.
If our model has 2 features years of experience and tests score, then our model is able to explain 80% of the variation in salary using the two input features.
Disadvantages of R2 score:
- As the number of input features increases, the R2 score tends to increase accordingly or it will remain the same but will never decrease, even though the input features are not important to our model (Eg Adding the temperature feature to our example, even though the temperature is not adding any importance to our output).
Adjusted R2 score:
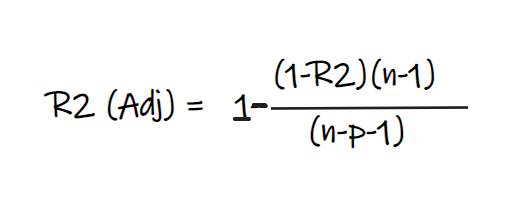
In the above formula, R2 is the R2 score, n is the number of observations(rows) and p is the number of independent features. Adjusted R2 score solves the problem of R2 score.
Consider the below 2 cases:
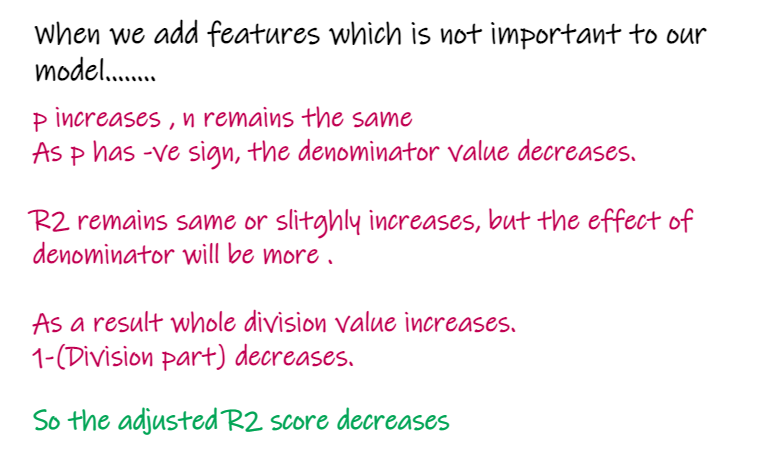
- When we add the features which are not so important to our model, like adding temperature to predict the salary…..
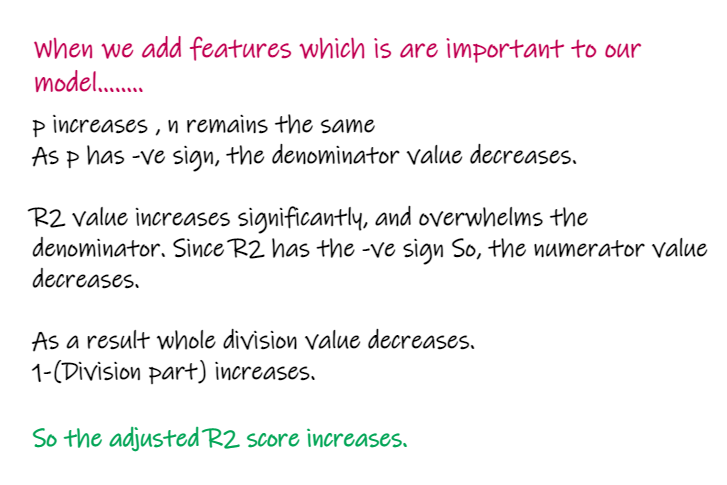
2. When we add the features which are important to our model, like adding test scores to predict the salary….
So you have understood the various metrics used in the regression problems with their advantages and disadvantages. Thank you for reading……
You can read about the classification metrics in the below blog.
If you are confused about the normalization and standardization then you can read the below blog.
Which feature scaling technique to use- Standardization vs Normalization.
You can connect with me on LinkedIn.
Mlearning.ai Submission Suggestions
5 Regression Metrics Explained in Just 5mins was originally published in Towards AI on Medium, where people are continuing the conversation by highlighting and responding to this story.
Join thousands of data leaders on the AI newsletter. It’s free, we don’t spam, and we never share your email address. Keep up to date with the latest work in AI. From research to projects and ideas. If you are building an AI startup, an AI-related product, or a service, we invite you to consider becoming a sponsor.
Published via Towards AI
Towards AI Academy
We Build Enterprise-Grade AI. We'll Teach You to Master It Too.
15 engineers. 100,000+ students. Towards AI Academy teaches what actually survives production.
Start free — no commitment:
→ 6-Day Agentic AI Engineering Email Guide — one practical lesson per day
→ Agents Architecture Cheatsheet — 3 years of architecture decisions in 6 pages
Our courses:
→ AI Engineering Certification — 90+ lessons from project selection to deployed product. The most comprehensive practical LLM course out there.
→ Agent Engineering Course — Hands on with production agent architectures, memory, routing, and eval frameworks — built from real enterprise engagements.
→ AI for Work — Understand, evaluate, and apply AI for complex work tasks.
Note: Article content contains the views of the contributing authors and not Towards AI.
Related posts
Recent Posts


