


Scaling vs. Normalizing Data
Last Updated on January 6, 2023 by Editorial Team
Last Updated on January 10, 2021 by Editorial Team
Author(s): Lawrence Alaso Krukrubo
Data Science
Understanding When to Apply One or the Other…
Intro:
When it comes to data exploration and model building, there are multiple ways to perform certain tasks and often, it all boils down to the goals and the experience or flair of the Data Scientist.
For Example, you may want to normalize data via the L1 (Manhattan Distance) or L2 (Euclidean Distance) or even a combination of both.
It’s common practice to interchange certain terms in Data Science. Methods are frequently interchanged with functions and vice-versa. These have similar meanings but by behaviour, functions take in one or more parameters, while methods are usually called upon objects…
print(‘hello’) # function
df.head() # method
We see the same interplay in the words mean and average…
The words “mean” and “average” are often used interchangeably. The substitution of one word for the other is common practice. The technical term is “arithmetic mean,” and “average” is technically a center location. However, in practice among non-statisticians, “average” is commonly accepted for “arithmetic mean.” (openstax.org)
Overview:
Scaling and normalization are often used interchangeably. And to make matters more interesting, scaling and normalization are very similar!
Similarities:

In both scaling and normalization, you’re transforming the values of numeric variables so that the transformed data points have specific helpful properties. These properties can be exploited to create better features and models.
Differences:

In Scaling, we’re changing the range of the distribution of the data… While in normalizing, we’re changing the shape of the distribution of the data.
Range is the difference between the smallest and largest element in a distribution.
Scaling and normalization are so similar that they’re often applied interchangeably, but as we’ve seen from the definitions, they have different effects on the data. As Data Professionals, we need to understand these differences and more importantly, know when to apply one rather than the other.
Why Do We Scale Data?
Remember that in scaling, we’re transforming the data so that it fits within a specific scale, like 0-100 or 0-1. Usually 0-1. You want to scale data especially when you’re using methods based on measures of how far apart data points are.
For example, while using support vector machines (SVM) or clustering algorithms like k-nearest neighbors (KNN)…
With these algorithms, a change of “1” in any numeric feature is given the same importance. Let’s take an example from Kaggle.
Imagine you’re looking at the prices of some products in both Yen and US Dollars. One US Dollar is worth about 100 Yen, but if you don’t scale your prices, algorithms like SVM or KNN will consider a difference in price of 1 Yen as important as a difference of 1 US Dollar!
This clearly doesn’t fit our intuitions of the world. So generally, we may need to scale data for machine learning problems so that all variables have quite similar distribution range to avoid such issues.
By scaling your variables, you can help compare different variables on equal footing…(Kaggle)
Some Common Types of Scaling:
1. Simple Feature Scaling:

This method simply divides each value by the maximum value for that feature…The resultant values are in the range between zero(0) and one(1)
Simple-feature scaling is the defacto scaling method used on image-data. When we scale images by dividing each image by 255 (maximum image pixel intensity)
Let’s define a simple-feature scaling function …
We can see the above distribution with range[1,10] was scaled via simple-feature scaling to the range[0.1, 1], quite easily.
2. Min-Max Scaling:
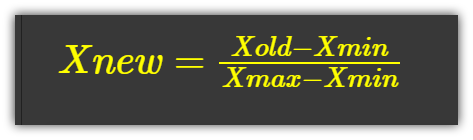
This is more popular than simple-feature scaling. This scaler takes each value and subtracts the minimum and then divides by the range(max-min).
The resultant values range between zero(0) and one(1).
Let’s define a min-max function…
Just like before, min-max scaling takes a distribution with range[1,10] and scales it to the range[0.0, 1].
Apply Scaling to a Distribution:
Let’s grab a data set and apply Scaling to a numerical feature. We’d use the Credit-One Bank credit loan customers dataset.
This time, we’ll use the minmax_scaling function from mlxtend.preprocessing. Let’s see the head of the data set.
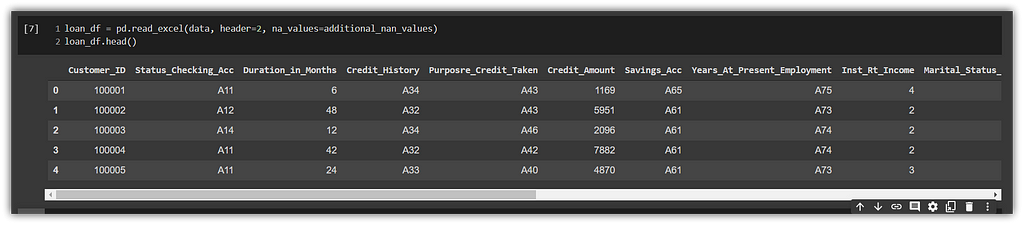
Ok, let’s for the sake of practice, scale the ‘Age’ column of the data
After scaling the data, we can see from the image below that the original dataset has a minimum age of 19 and a maximum of 75. And, the scaled dataset has a minimum of [0.] and maximum of [1.]
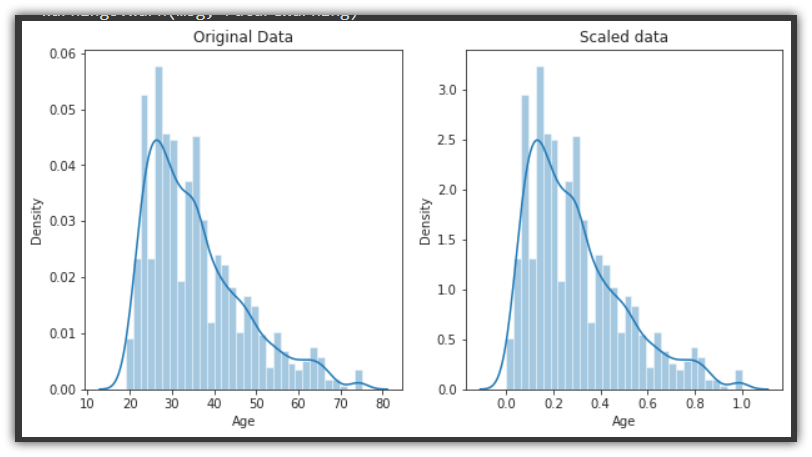
The only thing that changes, when we scale the data is the range of the distribution… The shape and other properties remain the same.
Why Do We Normalize Data?
Normalization is a more radical transformation. The point of normalization is to change your observations so that they can be described as a normal distribution… (Kaggle)
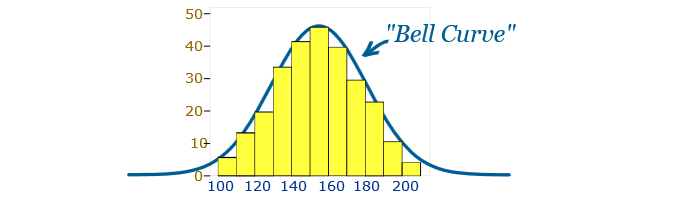
Normal distribution: AKA, “bell curve”, is a specific statistical distribution where roughly equal observations fall above and below the mean, the mean and the median are about the same, and there are more observations closer to the mean. The normal distribution is also known as the Gaussian distribution.
In general, you’ll normalize your data if you’re going to be using a machine learning or statistics technique that assumes your data is normally distributed. Some examples of these include linear discriminant analysis (LDA) and Gaussian naive Bayes.
(Pro tip: any method with “Gaussian” in the name probably assumes normality.)
Note that Normalization is also referred to as Standardization in some Statistical journals. Standardization aims to normalize the distribution by considering how far away each observation is from the mean in terms of the standard deviation. An example is the Z-Score.
Some Common Types of Normalization:
1. Z-Score or Standard Score:
For each value in the distribution, we subtract the average or mean…
And then divide by the Standard deviation. This gives a range from about minus 3 to 3, could be more, or less.
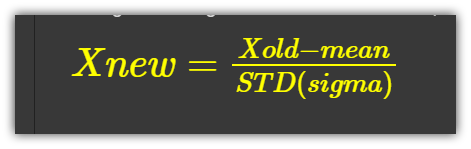
We can easily code it up, let’s define a Z-score method…
2. Box-Cox Normalization:
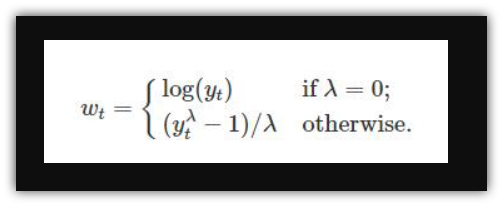
A Box-Cox transformation is a transformation of a non-normal dependent variable into a normal shape. The Box-Cox transformation is named after statisticians George Box and Sir David Roxbee Cox who collaborated on a 1964 paper and developed the technique… (link)
How it Works…
At the heart of the box-cox normalization is an exponent lambda (λ), which varies from -5 to 5. All values of λ are considered and the optimal value for your data is selected; The “optimal value” is the one which results in the best approximation of a normal distribution curve.
For those of us with some ML skills, this process is akin to tuning the learning-rate alpha (α), in order to produce a finer fit to the data
Box-Cox by default works for only positive values, but there’s a variant that can approximate negative values too. See this link. For more see this article.
Apply Normalization to a Distribution:
Let’s continue with the Credit-One Bank credit loan customers dataset. This time, we’d apply box cox transformation to the same Age Column. We’d use the boxcox() function from scipy.stats.
So we use the stats.boxcox() function, which returns a tuple with the normalized Series as the first element. The original dataset minimum is 19 and the maximum is 75. While the normalized dataset minimum is 1.300 and maximum is 1.4301
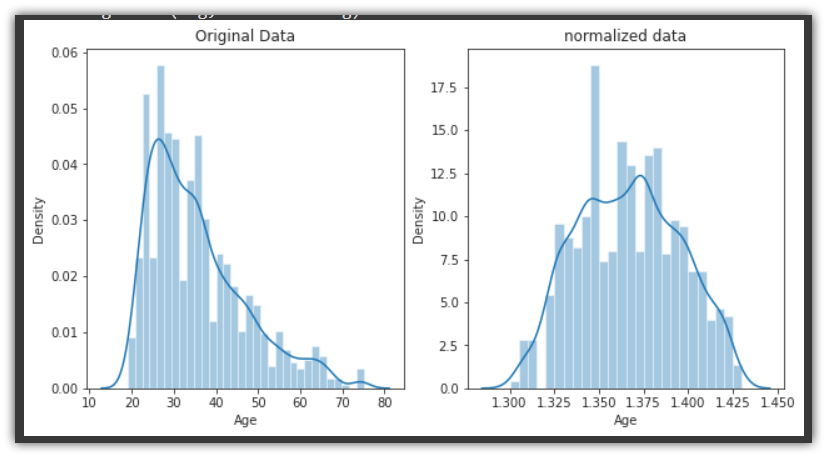
Notice that in addition to changing the range of the Age distribution, the normalization method radically transforms the shape of the distribution to a roughly bell-shaped curve.
Key TakeAways

- Always look at the data, pay attention to the distribution and shape of the data. Use a Histplot or Distplot or even a Line graph.
- In general, you’ll normalize your data if you’re going to be using a machine learning or statistics technique that assumes your data is normally distributed. Some examples include linear discriminant analysis (LDA) and Gaussian naive Bayes. In fact, any method with “Gaussian” or ‘normal’ in the name probably assumes normality. This also includes dimensionality reduction techniques like PCA.
- You want to scale data when you’re using methods based on measures of how far apart data points are, like support vector machines (SVM) or k-nearest neighbors (KNN). Or if you simply want your variables to dwell in a uniform range, so that one does not dominate the other.
- By scaling your variables, you can help compare different variables on equal footing.
- If you’re confused which of scaling or normalisation to use on a variable, a simple hack is to look at the shape of your distribution…
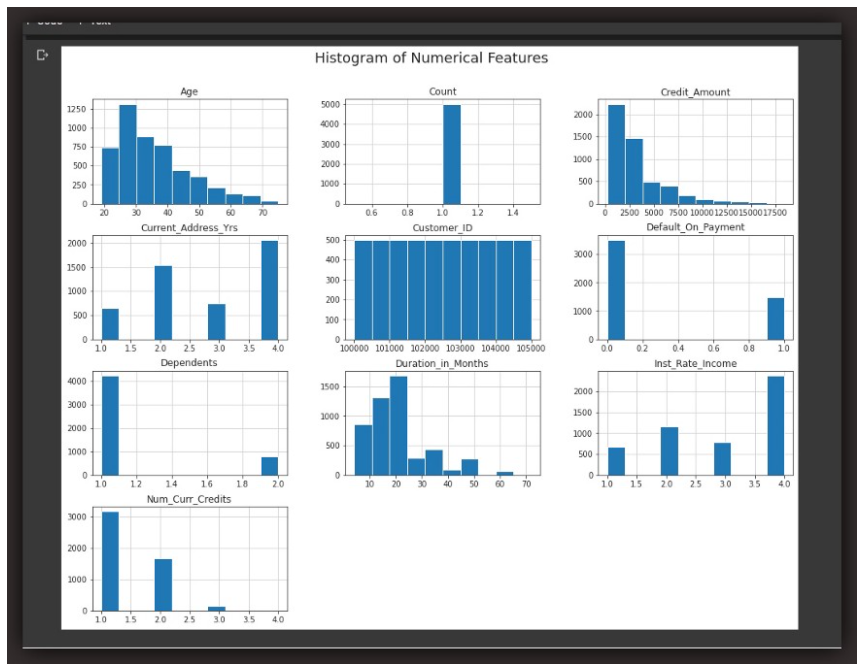
For example, looking at the Histplot of the numerical variables above, variables that seem almost symmetrical or that seem roughly bell-curved, even though the bell might be right-skewed or left-skewed, all such variables may be normalized. These are variables like ‘Age’, ‘Credit_Amount”, ‘Duration_in_Months’.
While the other variables that seem pretty ununiform, rather-distinct, unimodal and asymmetrical like ‘Count’, ‘Default_on_Payment’ and ‘Inst_Rate_Income’, may be scaled.
Visualization is key in EDA… If you observe via distplot or histplot, that some distributions are symmetrical or roughly normal, you may normalize such features except you have good reason not to. While features that have unimodal or asymmetrical shapes may generally be scaled via min-max or simple-feature scaling.
Cheers…
credit: IBM Data Analysis with Python Course and Data Cleaning Course on Kaggle
About Me:
Lawrence is a Data Specialist at Tech Layer, passionate about fair and explainable AI and Data Science. I hold both the Data Science Professional and Advanced Data Science Professional certifications from IBM. and the Udacity AI Nanodegree. I have conducted several projects using ML and DL libraries, I love to code up my functions as much as possible even when existing libraries abound. Finally, I never stop learning, exploring, getting certified and sharing my experiences via insightful articles…
Feel free to find me on:-
Scaling vs. Normalizing Data was originally published in Towards AI on Medium, where people are continuing the conversation by highlighting and responding to this story.
Published via Towards AI
Towards AI Academy
We Build Enterprise-Grade AI. We'll Teach You to Master It Too.
15 engineers. 100,000+ students. Towards AI Academy teaches what actually survives production.
Start free — no commitment:
→ 6-Day Agentic AI Engineering Email Guide — one practical lesson per day
→ Agents Architecture Cheatsheet — 3 years of architecture decisions in 6 pages
Our courses:
→ AI Engineering Certification — 90+ lessons from project selection to deployed product. The most comprehensive practical LLM course out there.
→ Agent Engineering Course — Hands on with production agent architectures, memory, routing, and eval frameworks — built from real enterprise engagements.
→ AI for Work — Understand, evaluate, and apply AI for complex work tasks.
Note: Article content contains the views of the contributing authors and not Towards AI.
Related posts


Recent Posts


")