Simplify Your Data Engineering Journey: The Essential PySpark Cheat Sheet for Success!
Last Updated on February 2, 2024 by Editorial Team
Author(s): Kamireddy Mahendra
Originally published on Towards AI.
“ It is not important to complete tasks blindly. It is important to complete tasks more efficiently with more effectiveness”
Yes, It is important to understand before getting into this cheat sheet. I hope that you have sufficient knowledge of big data and Hadoop concepts like Map, reduce, transformations, actions, lazy evaluation, and many more topics in Hadoop and Spark.
In this article, we are going to see the cheat sheet of Pyspark that will help you prepare for interviews for data engineering or data science roles in a short period. It will help you to revise entire transformations and data analysis parts we do in any tool whether it is in Databricks or any Python-related coding environments.
Let’s get into the context.
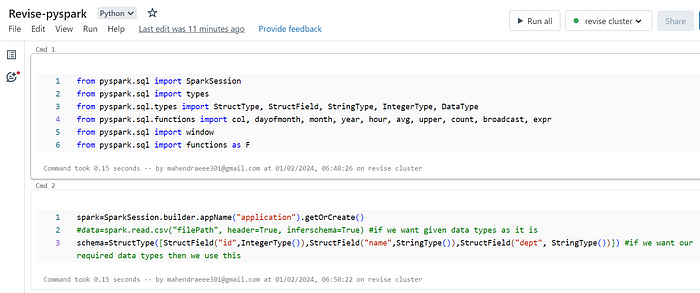
Before starting to do transformations or any data analysis using Pyspark it is important to create a spark session. Since it is the starting point of code execution in Spark. We will import as many modules as we require.
from pyspark.sql import SparkSession
from pyspark.sql import types
from pyspark.sql.types import SparkType, StructField, StringType, IntegerType, DataType
from pyspark.sql.functions import col, date, year, time, sum, avg, upper, count, Broadcast, expr
from pyspark.sql import window
from pyspark.sql import functions as F
spark=SparkSession.builder.appName("application").getOrCreate()
#read any file as given either csv, excel, parquet, or Avro any format of data
data=spark.read.csv("filePath", header=True, inferschema=True) #if we want given data types as it is
schema=StructType([StructField("id",IntegerType),StructField("name",StringType),
StructField("dept", StringType)] #if we want our required data types then we use this
#also for better performance of executions we will be using our custom schema rather depending on inferschema

Let’s start with building any application and start doing all code transformations and analysis part by taking some example data where ever is required.
data=[(1,'mahi', 100),(2,'mahendra', 200),(3,'harish',300),(4,'desh',400)]

schema=['id', 'name', 'salary']
#create a data frame
df=spark.createDataFrame(data,schema)
df.head()
df.show()
display(df)

Now find the cumulative sum of salaries. We can find it by using the window function.
a = Window().orderBy('id')
cumulative_sum = df.withColumn("cumulative_sum", sum("salary").over(a))
ans = cumulative_sum.orderBy('id')
ans.show()

a = Window().orderBy('id')
cumulative_sum = df.withColumn("cumulative_sum", avg("salary").over(a))
ans = cumulative_sum.orderBy('id')
ans.show()

emp=[(1,'mahi', 100,1),(2,'Mahendra, 200,2),(3,'harish',300,3),(4,'desh',400,4)]

schema=['id', 'name', 'salary', 'dept_id']
#create a data frame
df=spark.createDataFrame(data,schema)
df.head()
df.show()
display(df)

dept=[(1,'HR'),(2,'sales'),(3,'DA'),(4,'IT')]
schema=['dept_id', 'department']
department=spark.createDataFrame(dept,schema)
display(department)

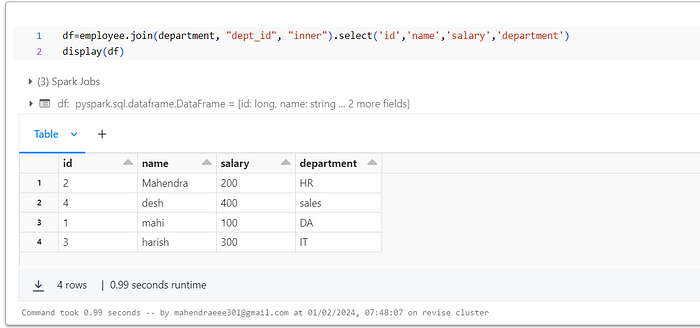
Let’s join two data frames using joins. we can join with a common attribute i.e. here it is department ID. With the help of that, we will join two data frames.
df=employee.join(department, "dept_id", "inner").select('id','name','salary','department')
display(df)

df=employee.join(department, "dept_id", "right").select('name','department')
display(df)

Similarly, we can do all executions. Sorry as I mentioned it is a cheat sheet i am going to present all formulas with executable codes. Just to make you understand I have executed the code till now.
Let’s get into pinpointing all formulas.
consider any example you want with one or more tables.
Filtering, selecting, aggregations, group by and order by conditions:
df = orders.join(products, "order_id", "inner") #apply joins of any
df.join(df2, 'any common column').groupBy('any column').count().orderBy(desc('count'))


df1=df.groupBy("cust_id").agg(sum("amount").alias("bill")) #apply group by function and the aggregation would by any

df.groupBy("col1").agg(count("col2").alias("count"),
 sum("col2").alias("sum"),
 max("col2").alias("maximum"),
 min("col2").alias("minimum"),
 avg("col2").alias("average")).show()


df.drop("column_name1", "column_name2", "column_name3") #droping columns
df.drop(col("column_name")) #another way of dropping columns

df.createOrReplaceTempView("any name you wish to assign") #convert data frame to table

df.orderBy(F.desc("column_name")).first() #return first row by descending order of any column for say salary
df.orderBy(col("column_name").desc()).first() #another way of returning the highest value record
df.orderBy(col("column_name").desc()).limit(5) #returning top 5 value record

#applying filters on any columns as our wish
df.filter(df.column_name==any value or any).show()

#selecting required columns as output with filters
df.select("column1", "column2", "column3").where(col("any column")=="any value")
df.select("column1").where(col("column1")> value).show(5)
df.sort("any column name")

#rename column name
df.withcolumn Renamed("already existing column name", "change column_name we want")
If any date attribute is in our data frame then we can extract the year, month, and day from the data frame and we can order either ascending or descending.
Extracting day, month and year from date column:
#extract year, month, and day details from the data frame
df.select(year("date column").distinct().orderBy(year("date column")).show()
df.select(month("date column").distinct().orderBy(month("date column")).show()
df.select(day("date column").distinct().orderBy(day("date column")).show()


df.withColumn("orderyear", year(("df.date column")
df.withColumn("ordermonth", month(("df.date column")
df.withColumn("orderday", day(("df.date column")
df.withColumn("orderquarter", quarter(("df.date column")
Apply the condition like, the value of a column should not be null and apply group by function with any order.
df.select("column name we want to retrieve").where(col("column name we want to retrieve").isNotNUll())\
.group by ("column name we want to retrieve").count().orderBy("count", ascending=False).show(10))
Write function:
write a file in any format in any mode with any location we want.
df.write.format("CSV").mode("overwrite").save("path that we want to store file")
df.write.format("CSV").mode("append").save("path that we want to store file")
df.write.format("Parquet").mode("overwrite").save("path that we want to store file")
df.write.format("parquet").mode("append").save("path that we want to store file")
Window Functions:
wind_a=Window.partitionBy("col1").orderBy("col2").rangeBetween(Window.unboundedpreceeding, 0)

df_w_coloumn= df.withColumn("col_sum", F.sum("salary").over(wind_a) #Rolling sum or cumulative sum:


#Row_number
a=Window.orderBy("date_column") #example consideration of date column you can choose any column
sales_data=df.withColumn("row_number", row_number().over(a))

#Rank
b=Window.partitionBy("date").orderBy("sales")
sales_data=df.withColumn("sales_rank", rank() over(b))

#Dense_rank
b=Window.partitionBy("date").orderBy("sales")
sales_data=df.withColumn("sales_dense_rank", desne_rank() over(b))


#Lag
c=Window.partitionBy("Item").orderBy("date") #considering example columns you can choose any column
sales_data=df.withColumn("pre_sales", lag(col("sales"),1).over(c))


#lead
d=Window.partitionBy("Item").orderBy("date") #considering example columns you can choose any column
sales_data=df.withColumn("next_sales", lead(col("sales"),1).over(d))
I hope this article will be helpful while preparing for data engineering interviews to review and recall the entire functions and formulas used in data bricks using Pyspark within 10 minutes to succeed in any data engineering interview.
Kindly support me with your appreciation, through clapping and feedback. It helps me to improve the quality of content and to share more content, don’t forget to follow me and subscribe to get instant updates from me. Thank you 🙂
Join thousands of data leaders on the AI newsletter. Join over 80,000 subscribers and keep up to date with the latest developments in AI. From research to projects and ideas. If you are building an AI startup, an AI-related product, or a service, we invite you to consider becoming a sponsor.
Published via Towards AI
Take our 90+ lesson From Beginner to Advanced LLM Developer Certification: From choosing a project to deploying a working product this is the most comprehensive and practical LLM course out there!
Towards AI has published Building LLMs for Production—our 470+ page guide to mastering LLMs with practical projects and expert insights!

Discover Your Dream AI Career at Towards AI Jobs
Towards AI has built a jobs board tailored specifically to Machine Learning and Data Science Jobs and Skills. Our software searches for live AI jobs each hour, labels and categorises them and makes them easily searchable. Explore over 40,000 live jobs today with Towards AI Jobs!
Note: Content contains the views of the contributing authors and not Towards AI.


