


Speed up EDA With the Intelligent Lux
Last Updated on January 6, 2023 by Editorial Team
Author(s): Pranavi Duvva
Data Analysis
Automate your visual data exploration with the new python library, Lux 💡.
Have you ever been tired of writing multiple lines of code even for a simple graph during EDA?
Did you ever wish for recommendation-based interactive graphs within the jupyter notebook itself?
If that’s a big yes!
Thankfully! We now have the new python library, Lux.
This article is based on Doris Jung-Lin Lee’s session in WiCDS 2021.
Lux is a python API for intelligent visual discovery, which comes with an inbuilt interactive jupyter widget.
- Lux could be your intelligent assistant which can automate the visual aspects of the exploratory data analysis.
- It provides powerful abstractions of the visualizations soon after the data frame has been displayed in the jupyter notebook with just a click.
- Lux is a very rich user intent-based language.
The main intention of the Lux Library is,to make the visualizations as simple as loading a dataframe.
The interactive Lux widget assists the user to quickly browse through the data and view important trends and patterns. It provides recommendations for the user to analyze further. Lux, can also create visualizations for those sections of the data, you have no clear idea about.
Lux works pretty well with the pandas and you do not have to worry about modifying the code. In fact, Lux was developed in such a way that, it preserves the pandas data frame semantics. This means it synchronizes its behavior with the pandas instructions itself.
That’s Awesome Right!
Let’s get started and bring in our intelligent visual assistant powered by Lux.
Installation requirements
- Lux can be installed through PyPI.
pip install lux-api
2. If you use conda, Lux can be installed by,
conda install -c conda-forge lux-api
3. For the setup in the jupyter notebook, you need to add the following extensions as well.
jupyter nbextension install --py luxwidget
jupyter nbextension enable --py luxwidget
That’s it! we are ready to go…
Case Study
Let’s consider an example dataset to explore the features of the Lux library.
I would be using the Graduate Admission dataset taken from the Kaggle data repository.
This dataset contains several parameters which are considered important during the application for Masters Programs.
Data Dictionary
- GRE Scores ( out of 340 )
- TOEFL Scores ( out of 120 )
- University Rating ( out of 5 )
- Statement of Purpose and Letter of Recommendation Strength ( out of 5 )
- Undergraduate GPA ( out of 10 )
- Research Experience ( either 0 or 1 )
- Chance of Admit ( ranging from 0 to 1 )
1. Importing all the necessary libraries
Now that the package has been successfully installed. We just have to import the lux library into our jupyter notebook.
2. Loading the data set and checking the concise summary
Let’s load the dataset and check the top 5 rows.
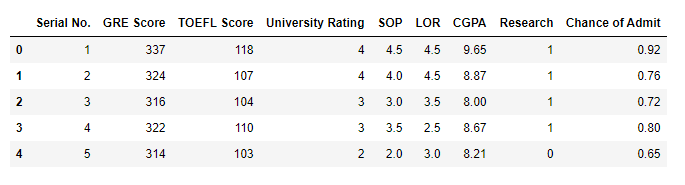
Checking the shape of the data set.
(400, 9)
There are a total of 400 rows and 9 columns.
Removing the first column Serial No. and checking the concise summary of the data set with the info()
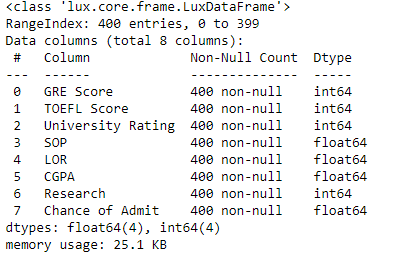
We observe that the data type of all the 8 columns in the dataset is numeric.
3. Visual Data Exploration with Lux 💡
Let’s now display the data frame and explore the Lux widget.
When the data frame is displayed Lux by default provides us with 3 tabs which are Correlation, Distribution, and Occurrence.
Let’s get to know each of these
- Correlation
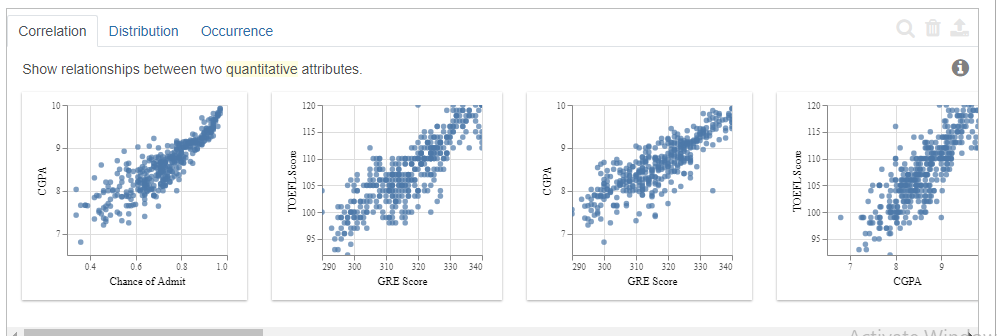
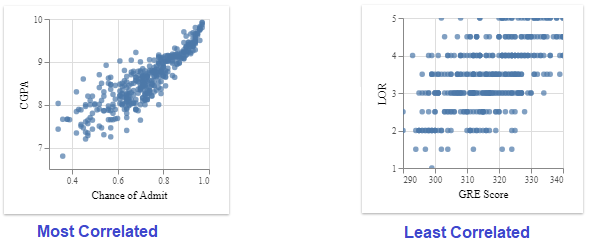
The correlation tab displays the relationship between the quantitative variables present in the dataset.
The order in which it displays is the most correlated ones to the least correlated ones.
2. Distribution
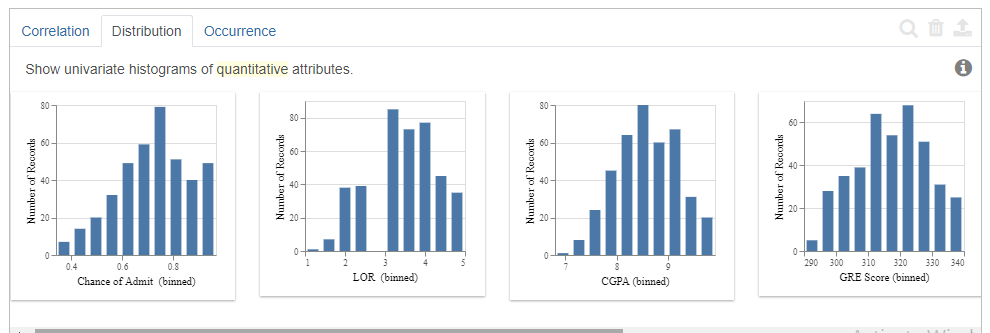
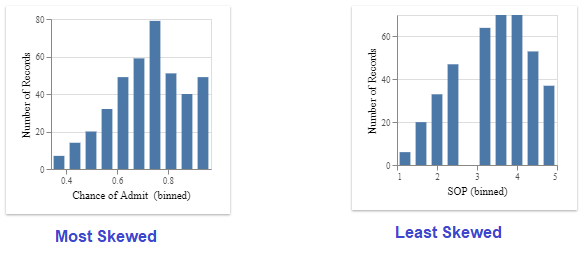
The distribution tab displays the histograms of the quantitative variables in the dataset.
The order in which it displays is the highly skewed ones to the least skewed ones.
3. Occurrence
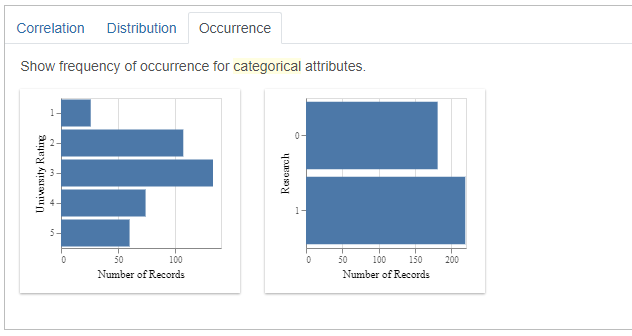
The occurrence tab displays the bar charts of the categorical attributes.
The order it follows is the most uneven distribution to the even distribution.
Although our dataset did not contain any features with the categorical data type. It did recommend bar charts for those features which it thinks might be useful for our analysis.
4. Visualizations and Recommendations based on user intent.
Let’s say you want to know more about a specific feature or multiple features together. You can get all the visualizations related to those attributes with the help of intent
The lux widget not only displays the visualization for that feature intended. But will also provide you with additional recommendations for further analysis with the help of Filter and Enhance options.
- Enhance
The Enhance feature of lux adds an additional attribute to the intended attributes specified by the user for visualization.
It lets the user compare the effect of the added attribute to the intended visualization. This is similar to adding a hue.
2. Filter
The filter lets the user visualize the intended attributes for different subsets of the data.
Let’s understand better with the following examples.
Consider one attribute CGPA,
df.intent=[“CGPA”]
df
1.Enhance Recommendations for one attribute
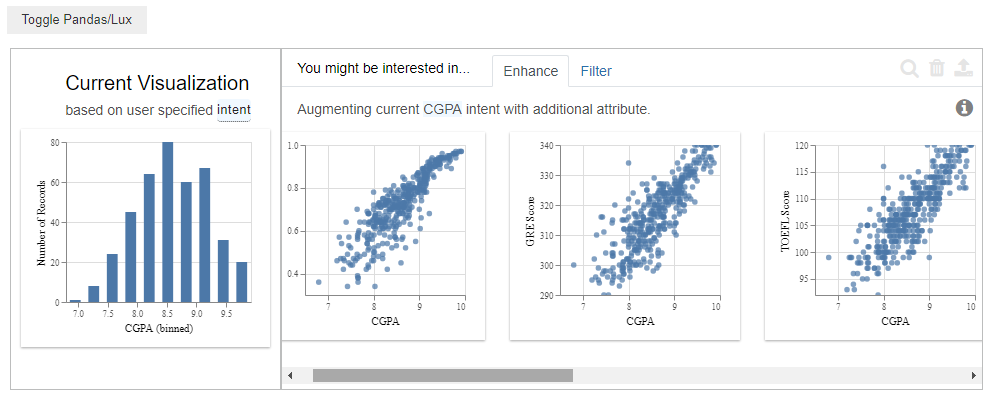
The Enhance tab when the given input is one feature “CGPA” fixes the intended variable “CGPA” on the x-axis and gives us recommendations by comparing it with different attributes.
2. Filter Recommendations for one attribute
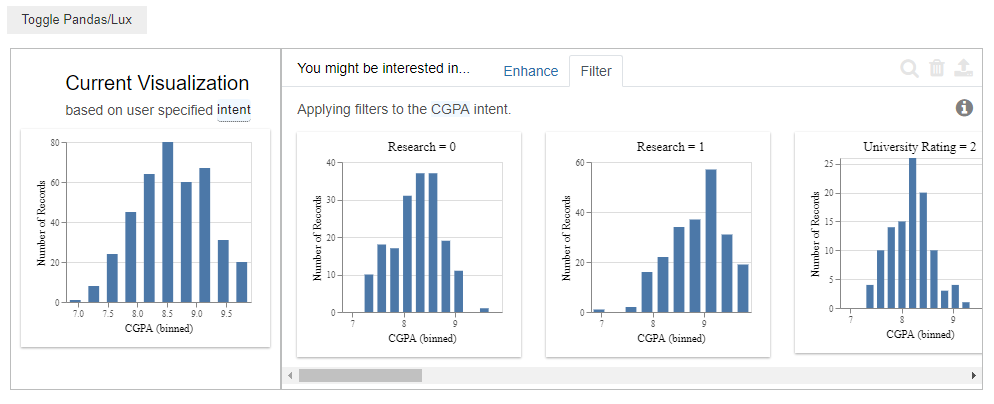
The Filter tab fixes the intended variable “CGPA” on the x-axis and gives us recommendations by comparing it with different subparts of the data set.
Consider two attributes “TOEFL Score” and “GRE Score”,
df.intent=[“TOEFL Score”,”GRE Score”]
df
1.Enhance Recommendations for two attributes
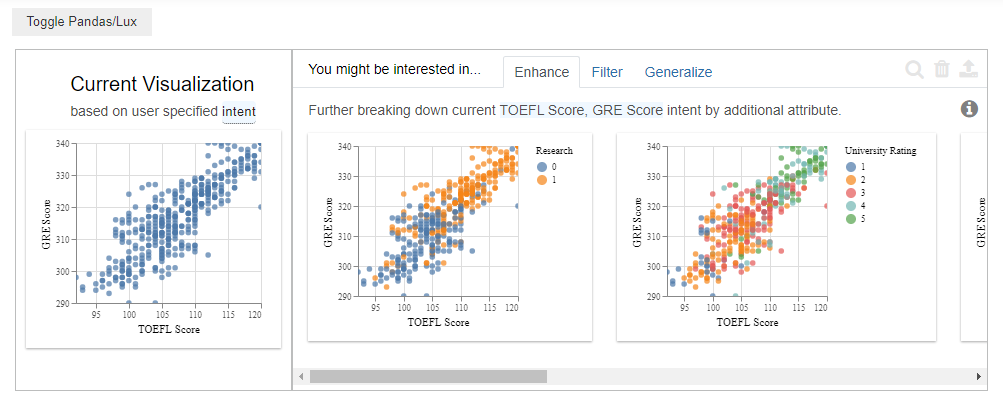
The Enhance tab when the given input is two attributes “TOEFL Score”, “GRE Score”. It fixes the intended variables “TOEFL Score” on the x-axis and the “GRE Score” on the y-axis. It then gives us recommendations by comparing with different attributes.
2. Filter Recommendations for two attributes
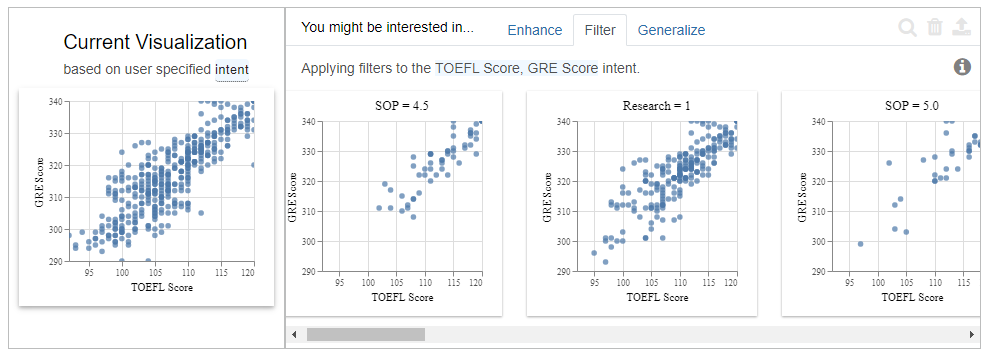
The Filter tab when the given input is two attributes “TOEFL Score”, “GRE Score”. It fixes the intended variable “TOEFL Score” on the x-axis and the “GRE Score” on the y-axis. It then gives us recommendations by comparing both together with different subparts of the data.
5. Exporting Visualizations.
Lux makes it very easy to share the visualizations. To export visualizations into a static HTML the following command has to be used.
df.save_as_html(“File name.html”)
Conclusion
Lux the new python open-source library is definitely making data exploration a lot easier. This article has demonstrated how Lux was able to automate most of our visualizations with very minimal code. It also explained some of the prominent features of the Lux library.
Status of Project Lux: Currently, Lux is in its early development stage.
Resources
To know more about the Lux library you can find the details at lux-API.
You can also try their Hands-on exercises or tutorials on Binder.
Hope you enjoyed reading this article!
Please feel free to check my other articles on pranaviduvva at medium.
Thanks for reading!
Speed up EDA With the Intelligent Lux was originally published in Towards AI on Medium, where people are continuing the conversation by highlighting and responding to this story.
Published via Towards AI
Towards AI Academy
We Build Enterprise-Grade AI. We'll Teach You to Master It Too.
15 engineers. 100,000+ students. Towards AI Academy teaches what actually survives production.
Start free — no commitment:
→ 6-Day Agentic AI Engineering Email Guide — one practical lesson per day
→ Agents Architecture Cheatsheet — 3 years of architecture decisions in 6 pages
Our courses:
→ AI Engineering Certification — 90+ lessons from project selection to deployed product. The most comprehensive practical LLM course out there.
→ Agent Engineering Course — Hands on with production agent architectures, memory, routing, and eval frameworks — built from real enterprise engagements.
→ AI for Work — Understand, evaluate, and apply AI for complex work tasks.
Note: Article content contains the views of the contributing authors and not Towards AI.
Related posts

")


Recent Posts


")

