The Misuse of Statistics
Last Updated on June 22, 2020 by Editorial Team
Author(s): Arghyamalya Biswas
Opinion, Statistics
Some people can misuse statistics because we can lie with statistics

“Politicians use statistics in the same way that a drunk uses lamp-posts for support rather than illumination” -A.Lang
Statistics is the primary tool for assessing relationships and evaluating study questions by revealing the underlying truth of unbiased data. Unfortunately, these tools are often misused either inadvertently because of ignorance or lack of planning or conspicuously and deliberately to achieve some particular target or result. In this era of Big Data, Statistics and its methods are vital because they not only help to summarize or analyze the data but also provide interpretations and further future consequences. These consequences(social, economical, etc.) are one of the key reasons that propel a politician (or political party) to distort data and statistical analysis for his (or their) own fulfillment. In many ways, a certain fact or conclusion can be altered by performing some statistical techniques carelessly or deliberately.
Let us consider a locality L. Suppose party A used to rule that locality. In a certain election party, B won over A. Thereafter, party B is ruling the locality L. Now Party B is willing to show that their performance has been better than that of party A because again, the election is coming, and obviously they don’t want to lose. Party B wants inhabitants of locality L to have a good impression on them before the vital election so they will use data and statistics in some way that will turn in favor of party B. Inhabitants of locality L were asked to mark the performances of party A and party B on a scale of 6(on the real line). Depending on the satisfaction levels of inhabitants, both the party were marked on their respective performances. Suppose, Now, Party B claims that people are more satisfied with them, and the overall satisfaction level is higher for party B than that of party A.
Here comes statistics to justify the claim raised by party B. Suppose, X denotes the satisfaction marks for the party A given by a randomly selected inhabitant in the locality and Y denotes the same for party B. In this background, it is clear that (X, Y) generates a paired data. Two standard tests, namely Fisher’s t-test and paired t-test, can be used to test for the hypothesis concerning equality of means. But paired t-test is used usually when we do have bivariate data, and Fisher’s t-test is used when two variables of interest are independent. So in this context, to test the hypothesis(above mentioned) paired t-test is expected to provide the prominent result. But what happens if one uses Fisher’s t-test instead of paired t-test using n data points on X and Y variables(sample size is n).
Suppose, n=10, then ten pairs of data on (X, Y) is given :
X: 1.77, 5.68, 0.07, 2.26, 2.60, 3.12, 3.56, 1.04, 2.68, 3.10
Y: 1.45, 3.93, -0.03, 1.01, 3.20, 2.02, 1.57, -0.61, 2.68, 2.43
Here, we are to test, H0:μ1=μ2 against H1:μ1>μ2 (where μ1, μ2 denotes mean satisfaction level of inhabitants by performances of party A and party B respectively)
We observe,
The test I i.e., Paired t-test rejects Ho if T1>c1=1.833.
So, Test I rejects Ho (null hypothesis) at a 5% level of significance.
Test II, i.e., Fishers Test rejects Ho if T2>c2=1.734
So, Test II accepts Ho(null hypothesis)at a 5% level of significance.
[T1 and T2 denotes the value of test statistics for paired t-test and Fisher’s t-test respectively, T1=3.024135, T2=1.262702]
This fact may induce party B to publish the conclusion based on Fisher’s t-test instead of the paired t-test simply because Fisher’s t-test does not have enough reason to deny their (party B’s) claim. Thus people living in locality L will be digesting a false fact.
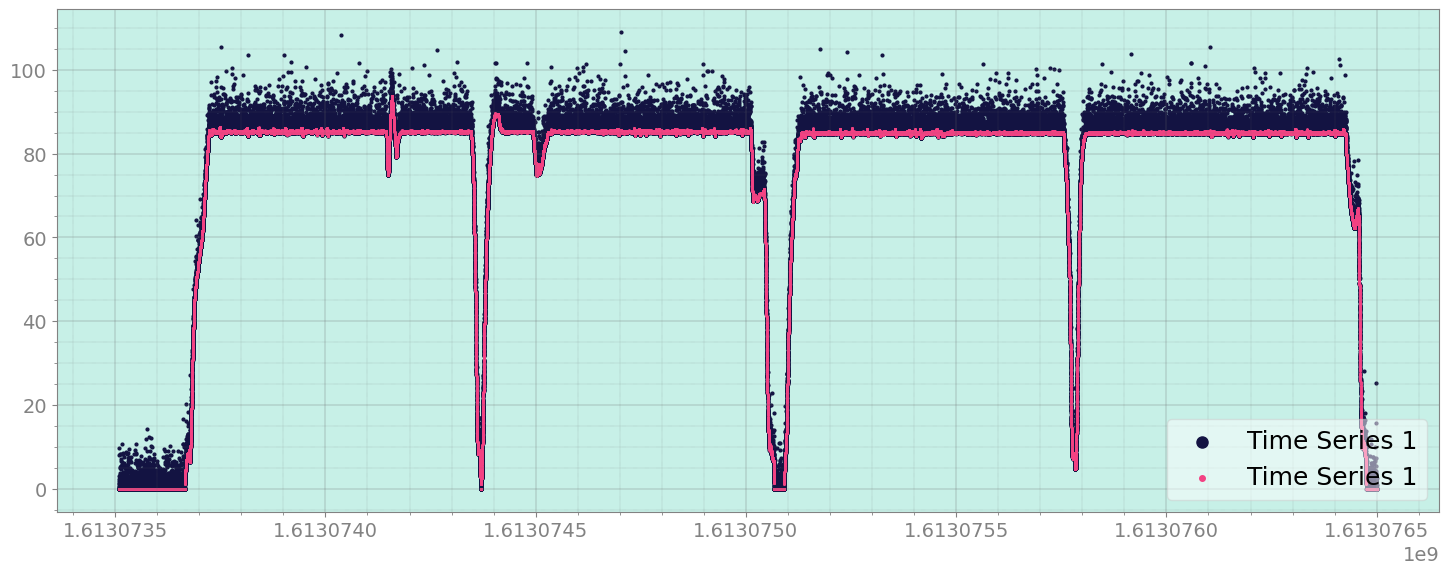
Although the above-mentioned trick of swapping or twisting the truth does not involve the worst factor, that is data manipulation the harsh truth of the real-world data is that data are manipulated even in the medical sector, social projects, environmental projects, etc. for certain political and other benefits. Sometimes tricks may be implemented in graphical diagrams like bar diagrams, histograms, time series plots, etc.
For a time-series data choice of the time interval is important in understanding the true trend of the variable of interest. In capturing the trend of employment rate, data must be seasonally adjusted. There are several little twisting factors that may produce ‘overestimates’ or ‘underestimates,’ and there are people always ready to use those estimates obtained by statistically wrong means.
Thus we see when this body of scientific methods, statistics is used in a misleading fashion can trick the casual observer into believing something other than what data really shows. This introduces statistical fallacy, which occurs when a statistical argument asserts a falsehood. This type of cheap activity with data in this century of data should be abolished immediately, and this can happen if we become more aware of statistics with understanding.
“False Facts are highly injurious to the progress of science, for they often long endure; but false views if supported by some evidence, do little harm, as everyone takes a salutary pleasure in proving their falseness; and when this is done, one path towards error is closed, and the road to truth is often at the same time opened”-Charles Darwin, The Descent
The Misuse of Statistics was originally published in Towards AI — Multidisciplinary Science Journal on Medium, where people are continuing the conversation by highlighting and responding to this story.
Published via Towards AI
Take our 90+ lesson From Beginner to Advanced LLM Developer Certification: From choosing a project to deploying a working product this is the most comprehensive and practical LLM course out there!
Towards AI has published Building LLMs for Production—our 470+ page guide to mastering LLMs with practical projects and expert insights!

Discover Your Dream AI Career at Towards AI Jobs
Towards AI has built a jobs board tailored specifically to Machine Learning and Data Science Jobs and Skills. Our software searches for live AI jobs each hour, labels and categorises them and makes them easily searchable. Explore over 40,000 live jobs today with Towards AI Jobs!
Note: Content contains the views of the contributing authors and not Towards AI.


