


Implementing GraphX/Graph-frames in Apache Spark
Last Updated on January 6, 2023 by Editorial Team
Last Updated on September 13, 2020 by Editorial Team
Author(s): neupane parlad
Programming
Analysis using Family Members and Friend relationship similar to LinkedIn
We are exploring the family member relationship with each other and friends using GraphX. There are six family members with father, mother, son, daughter, and two friends. We are trying to answer which family member has to most connection and which family member has the least connection. Also, we can see the level of relationship between records in the dataset. These are the questions solve by GraphX and has been largely used by companies like Facebook and LinkedIn.
GraphX Introduction
GraphX is Apache Spark’s API for graphs and graph-parallel computation. GraphX unifies ETL (Extract, Transform & Load) process, exploratory analysis, and iterative graph computation within a single system. The usage of graphs can be seen in Facebook’s friends, LinkedIn’s connections, internet routers, relationships between galaxies and stars in astrophysics and Google’s Maps.
In Spark, you can get a lot of details about the graphs such as list and number of edges, nodes, neighbors per nodes, in-degree, and out-degree score per each node. The basic graph functions that can be used in PySpark are the following: * vertices * edges * inDegrees * outDegrees * degrees
Analysis of Family Member Relationship
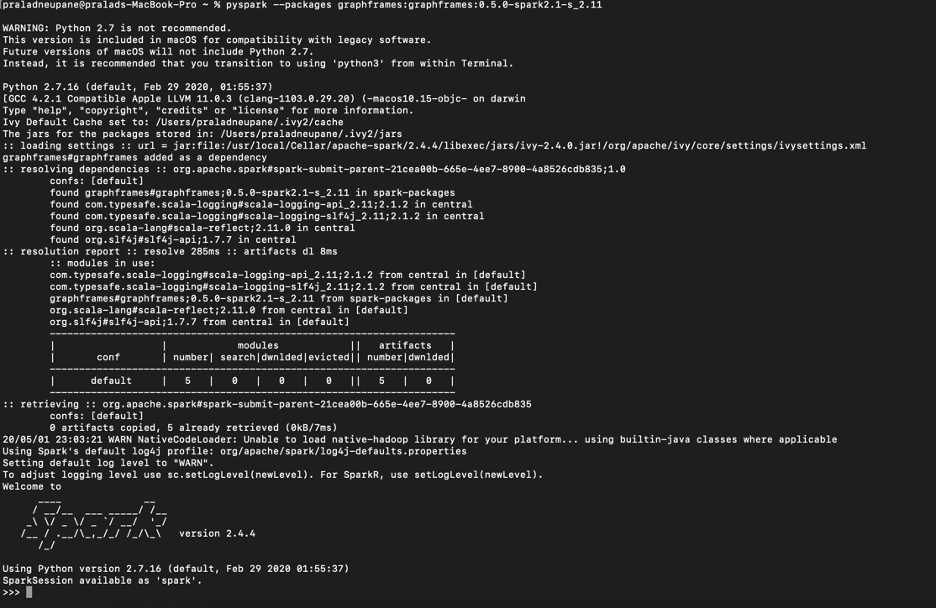
This we how we start the GraphX in PySpark
pyspark --packages graphframes:graphframes:0.5.0-spark2.1-s_2.11
This is what it looks like once you start the GraphX
This is how you can import a graphframe
from graphframes import *
Data Sets
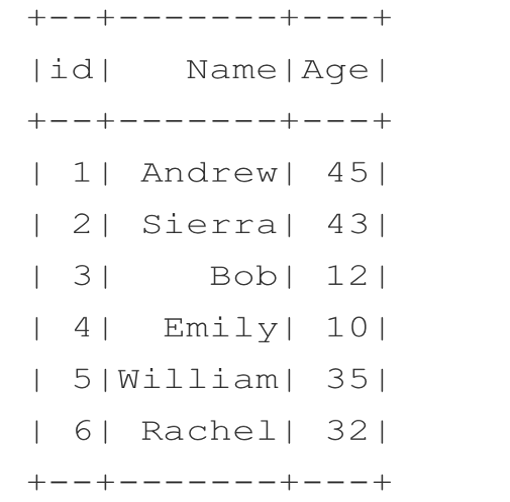
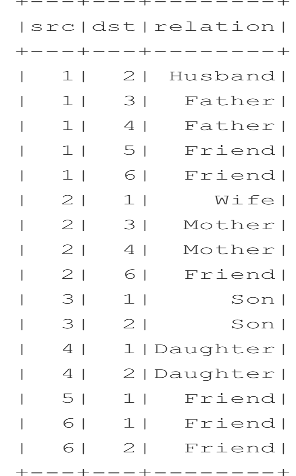
We have two tables named person and relationship. A person has an id, name, and age. A relationship table contains a source, destination, relationship. Here source and destination are user ids to relationship column show the relationship between them.
We are going to explore the relationship between family members and friends. We can also categorize the level of relationship between peoples. This has a broad range of applications like finding connections between people, social media analysis, etc.
Sample Code
Understanding Degrees in graphs
degrees
The degree of each vertex in the graph returned as a DataFrame with two columns:
– “id”: the ID of the vertex
– ‘degree’ (integer) the degree of the vertex
Note: That vertices with 0 edges are not returned in the result.
inDegrees
The in-degree of each vertex in the graph returned as a DataFame with two columns:
– “id”: the ID of the vertex
– “inDegree” (int) storing the in-degree of the vertex
Note: That vertices with 0 in-edges are not returned in the result. Returns DataFrame with new vertices column “inDegree”
outDegrees
The out-degree of each vertex in the graph returned as a DataFrame with two columns:
– “id”: the ID of the vertex
– “outDegree” (integer) storing the out-degree of the vertex
Note: that vertices with 0 out-edges are not returned in the result. Returns DataFrame with new vertices column “outDegree”
Example
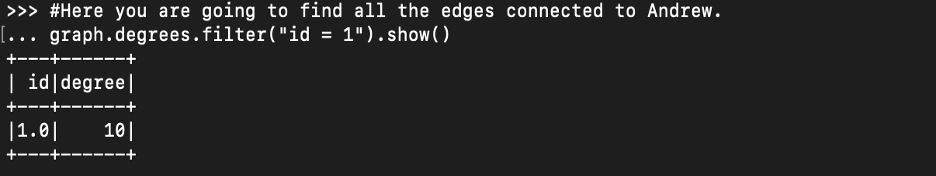
Find all the edges connected to Andrew
Find all incoming connection to Andrew
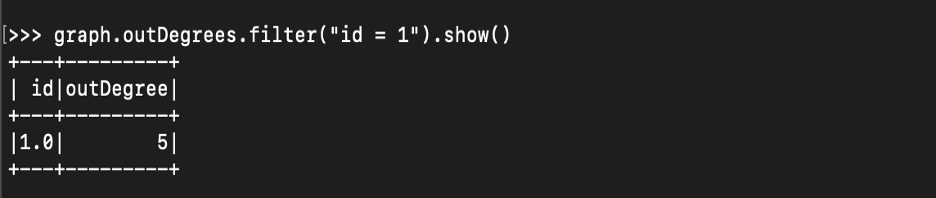
Determine the number of links coming out from Andrew using the outDegrees
Triangle Count Problem
This count column identifies how many triangle relationships the vertex is participating in.

The output shows that Andrew and Sierra have the maximum triangle counts, since they are involved in three kinds of relationships apply a PageRank Algorithm. It was originally started by Google’s founders to identify the most important pages on the Internet. The PageRank algorithm measures the importance of each vertex in a graph. Assume a scenario where one Twitter user has 10 important followers, and each of those followers has multiple followers in turn. This is to say that the PageRank algorithm considers each important follower a legitimate endorsement of the Twitter user and thereby gives a higher ranking to the user.
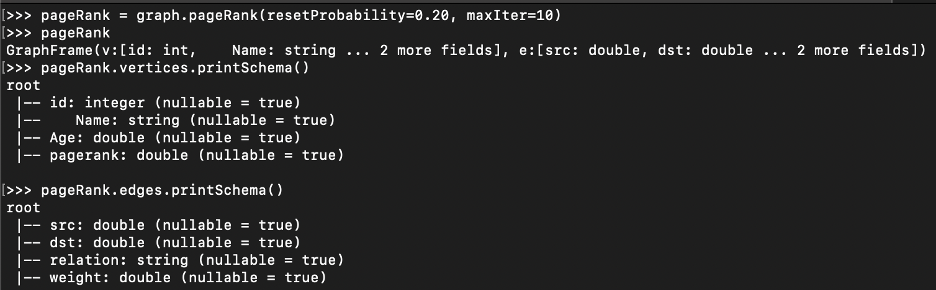
>>> pageRank = graph.pageRank(resetProbability=0.20, maxIter=10)
Here, we are calling the PageRank algorithm using the pageRank methods. It takes two attributes
- resetProbablity: This value is a random value reset probability (alpha).
- maxIter: This is the number of times you want pageRank to run.
You can see from the original person’s schema that a new column has been added called PageRank and new column weight has been added to the original relationship schema. These both columns contributed to the PageRank score
What is the PageRank Score?
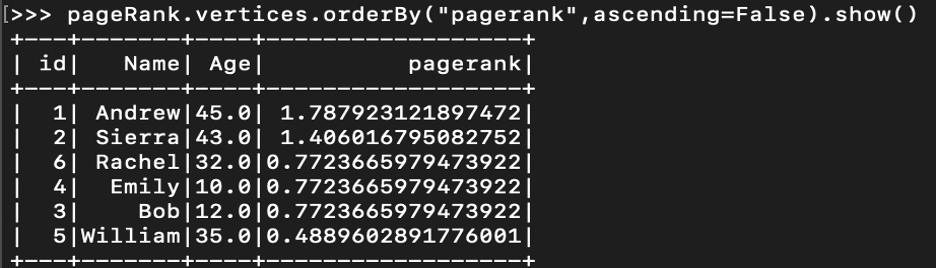
Let’s look at the weight: weight is the determining factor to calculate page rank
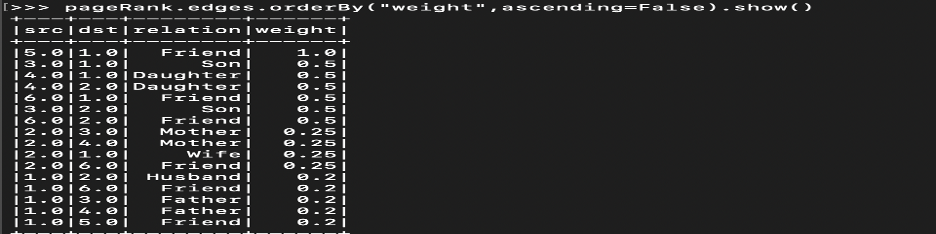
As you can see from the table William’s relationship with Andrew gets the maximum weight since it is unique. No one other than Andrew is a friend to William. By applying the Breadth-First Algorithm let’s find the shortest way to connect to the people. We are going to apply for BFS.
You might have often noticed LinkedIn telling you how far you are from any new user. For example, you will notice that a user whom you would like to connect to is a second connection or a third connection. This tells you that you are two vertices away from the vertex from where you are looking. This is one way of identifying how far a vertex is to another vertex.
Another example is finding the shortest path between two cities or two airports. Breadth-First Search is one of the shortest path-finding algorithms and it helps us identify the shortest path between two vertices.
Find the connection between Bob and William Since only Andrew is directly connected to William. So, for Bob to be able to connect to William.
What is the Shortest Path? How to Find it?
GraphFrames provides an API, called bfs(Breadth-first search), which takes a minimum of two parameters. Those are fromExpr: Expression to identify the from vertex. toExpr: Expression to identify the vertex.
graph.bfs(fromExpr=””Name=’Bob’””,toExpr=””Name=’William’””).show()
This shows the shortest path between William and Bob. It can be more practical if we try to find the real distance. You can replace people’s names with city names and find the shortest path.
Next Story
I am going to publish the implementation of the Machine Learning Algorithm in Spark to predict the housing price for next year by implementing the following algorithms. Please post feedback on this one.
1. Decision Tree Regression
2. Random Forest Regression
3. Gradient Boosted Tree Regression
Implementing GraphX/Graph-frames in Apache Spark was originally published in Towards AI — Multidisciplinary Science Journal on Medium, where people are continuing the conversation by highlighting and responding to this story.
Published via Towards AI
Towards AI Academy
We Build Enterprise-Grade AI. We'll Teach You to Master It Too.
15 engineers. 100,000+ students. Towards AI Academy teaches what actually survives production.
Start free — no commitment:
→ 6-Day Agentic AI Engineering Email Guide — one practical lesson per day
→ Agents Architecture Cheatsheet — 3 years of architecture decisions in 6 pages
Our courses:
→ AI Engineering Certification — 90+ lessons from project selection to deployed product. The most comprehensive practical LLM course out there.
→ Agent Engineering Course — Hands on with production agent architectures, memory, routing, and eval frameworks — built from real enterprise engagements.
→ AI for Work — Understand, evaluate, and apply AI for complex work tasks.
Note: Article content contains the views of the contributing authors and not Towards AI.


Recent Posts


")

