Logo:
Logo:  Areas Served:
Is the Data Analytics Era Coming to an End?
Last Updated on July 1, 2020 by Editorial Team
Author(s): Manmohan Singh
Data Analytics, Opinion
Importance of Text Analytics in NLP
Can you recall, when the last time have you used text analytics? Or read an article about it on medium and other blogs? Do you know any improvement has done on text visualization in the past?
Answers of these questions tell you a declining trend in text analytics. One of the big reasons for this decline is the introduction of transformer architecture in 2017. Natural Language Processing (NLP) field has become a rising star in data science after this.
Based on this architecture, the OpenAI team has launched the Generative Pretrained Transformer(GPT) series models. And Google has launched the Bidirectional Encoder Representations(BERT) model. These models achieve state-of-the-art scores on a variety of domain-specific NLP tasks. As a result, NLP got dominated by problems like classification, text generation, and text summarization.
Another reason for text analytics losing its charm is because Kaggle and other competition platforms also give priority to non-visualization problems. And medium and other data science blogs have focused more on deep learning models.
That doesn’t mean that it has lost its charm. Here, we will discuss how much importance of text data analytics holds in the NLP world.
These questions will help us to decide whether text analytics holds any future in NLP or not.
1. Is the word cloud useful?
2. How you represent the output of classification models?
3. Is word frequency methods still work ?
4. Is a pattern or trend in text data visualization useful?
Let’s dig into these questions.
1. Is a word cloud useful?
Word cloud is an image that visualizes the trending/popular word of text data. The font size of words in the word cloud depends on its frequency in text data. It is an easy way to highlight an important topic on the internet. It grabs your attention in a single glance. Here are examples of a word cloud built on data of the Reddit subgroup.
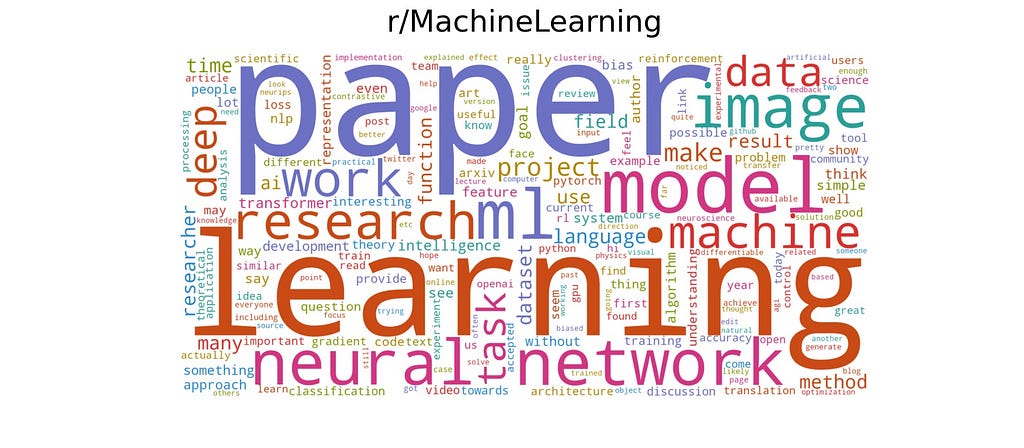
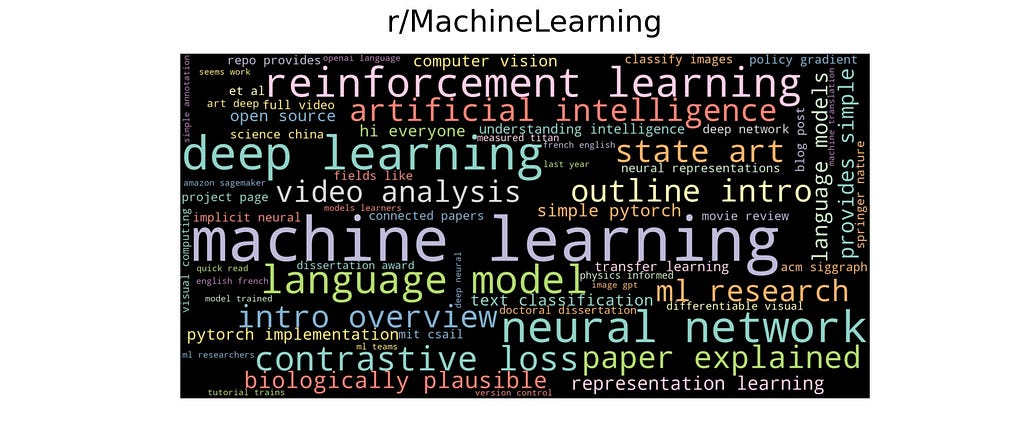
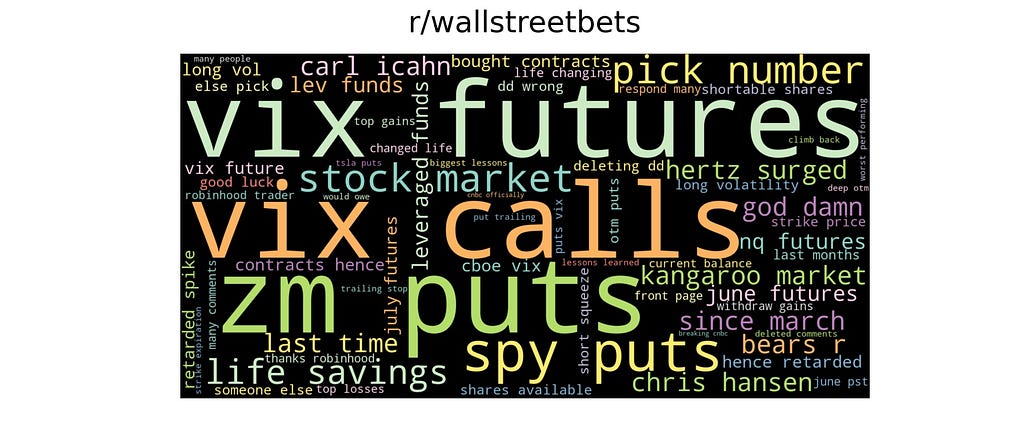
Data for word-cloud has obtained from Reddit subgroup r/machinelearning and r/wallstreetbets. Word cloud built from two words combination is making more sense than a single word combination. It has some presence in the data science field.
2. How you represent the output of classification models?
Let’s say you have built a model which categorize customer review into six categories. And this model classifies five thousand reviews and store the result into the table. How you present these results to stakeholders? I choose the bar graph to do the job because its easy to interpret results in graphs than other formats.
Here is a visualization of toxic comments classification of labels data.
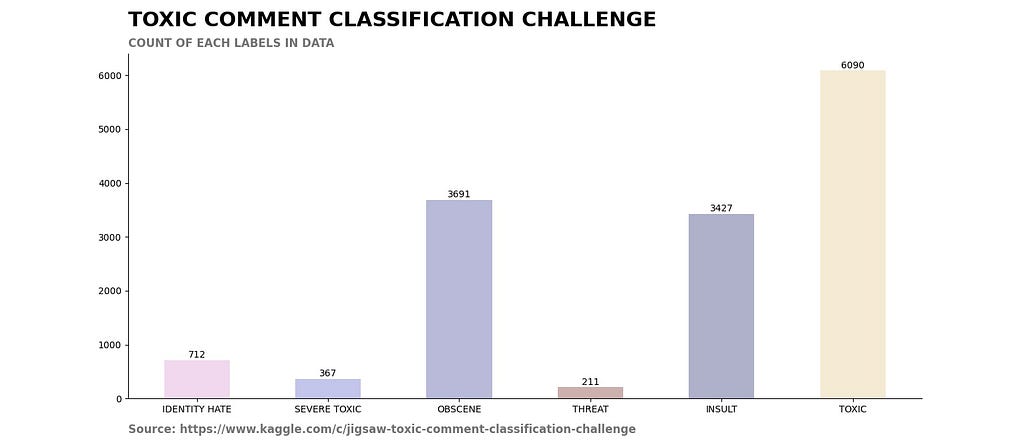
This bar graph shows an unbalanced dataset. For higher accuracy and F1 score, we need balanced data. Because of the representation of such data, these graphs hold importance in the NLP tasks.
3. Is word frequency methods still work?
Word frequency is a count of each word in a document or text data. Words that connect different words in a sentence are known as stopwords. These words carry no dictionary meaning. So, we can ignore these words. know more about stopwords here. Earlier while preparing machine learning models, we remove stopwords from data to reduce dimensionality and achieve high accuracy of the model. Now, this method is no longer needed.
TF-IDF (term frequency-inverse document frequency) is a pre-processing step for machine learning models. I wonder if anyone uses the TF-IDF method for current model preparation.
Stemming and lemmatization are also not used while building deep learning models. Know more about stemming and lemmatization here.
The attention mechanism has replaced the above methods.
Now, these methods mostly used to find words of great importance in text data. You can categorize articles or books based on word frequency. Word frequency also helps to create tags for articles and books.
Here are the top 10 words calculated by the TF-IDF method.

4. Is a pattern or trend in text data visualization useful?
Trending topics tells us whats going on in this world. And no one wants to be left behind in this world. So we always track trending topics and related pieces of information. But these post not always trend. They rise and fall. What is the best way to represent the rise and fall of the post other than time-series graphs? The Time-series graph helps to discover trends and patterns. You can get trending topics from Google trends. They show you which words are trending along a timeline.
Visualization also helps to find the pattern in customer reviews. It helps you to discover some interesting facts about different products.
Here is the Google trend for Machine Learning text.
You may have more use-cases or methods that use text visualization. If you have any use-case, please mention in the comment section, I will try to include those use-cases in this article.
All these methods do not hold high importance in the data science field. Mostly these techniques are limited to simple NLP tasks. They are easy to use and require less explanation. In the end, we are still using these techniques to represent some part of text data or work on the NLP task.
Conclusion
Text analytics and visualization are not as important as the way they used to be. Some methods have become obsolete because of the advancement in deep learning. And it’s a good thing that the NLP field has received great success. Text analytics and visualization need a makeover and improvement. Hopefully, you are still using some of the above methods for your NLP tasks.
Is the Data Analytics Era Coming to an End? was originally published in Towards AI — Multidisciplinary Science Journal on Medium, where people are continuing the conversation by highlighting and responding to this story.
Published via Towards AI
Related posts
Popular posts

 for 2021")


Updates

Recent Posts