


Top 10 Interview Questions on Evaluation Metrics in Machine Learning
Last Updated on July 25, 2023 by Editorial Team
Author(s): Simranjeet Singh
Originally published on Towards AI.
Introduction
Evaluation metrics are quantitative measures used to assess the performance of machine learning models. They are important because they provide a systematic and objective way of comparing different models and measuring their success in solving a particular problem. By comparing the results of different models and evaluating their performance, data scientists can make informed decisions about which models to use, how to improve existing models, and how to optimize their performance for a given task. Evaluation metrics play a crucial role in the development and deployment of machine learning models, as they provide a clear understanding of how well the models are performing and where there is room for improvement.
U+1F449 Before Starting the Blog, Please Subscribe to my YouTube Channel and Follow Me on Instagram U+1F447
U+1F4F7 YouTube — https://bit.ly/38gLfTo
U+1F4C3 Instagram — https://bit.ly/3VbKHWh
U+1F449 Do Donate U+1F4B0 or Give me Tip U+1F4B5 If you really like my blogs, Because I am from India and not able to get into Medium Partner Program. Click Here to Donate or Tip U+1F4B0 — https://bit.ly/3oTHiz3
1. Can you explain the difference between precision and recall in the context of evaluation metrics for machine learning models?
Precision and recall are two commonly used evaluation metrics in the context of machine learning models. Precision is a measure of the number of true positive predictions made by the model out of all positive predictions. Precision represents the ability of the model to avoid false positive predictions.
Precision = TP/TP+FP
On the other hand, recall is a measure of the number of true positive predictions made by the model out of all actual positive instances in the dataset. The recall represents the ability of the model to correctly identify all positive instances.
Recall = TP/TP+FN
Both precision and recall are important evaluation metrics, but the trade-off between them depends on the specific problem being solved and the requirements of the stakeholders. For example, in medical diagnosis, recall might be more important because it is essential to identify all cases of a disease, even if this results in a higher rate of false positives. In contrast, in fraud detection, precision might be more important because it is essential to avoid false accusations, even if this results in a higher rate of false negatives.
2. How do you choose an appropriate evaluation metric for a given problem?
Choosing an appropriate evaluation metric for a given problem is a critical aspect of the model development process. In selecting an evaluation metric, it is important to consider the nature of the problem and the goals of the analysis. Some common factors to consider include:
Problem type: Is it a binary classification problem, multi-class classification problem, regression problem, or something else?
Business objective: What is the end goal of the analysis, and what kind of performance is desired? For example, if the objective is to minimize false negatives, recall would be a more important metric than precision.
Dataset characteristics: Are the classes balanced or imbalanced? Is the dataset large or small?
Data quality: What is the quality of the data and how much noise is present in the dataset?
Based on these factors, a data scientist may choose an evaluation metric such as accuracy, F1-score, AUC-ROC, Precision-Recall, mean squared error, etc. It is important to also keep in mind that often, multiple evaluation metrics are used to get a complete understanding of model performance.
3. Can you discuss the use of the F1 score as a measure of model performance?
The F1 score is a commonly used evaluation metric in machine learning that balances precision and recall. Precision measures the proportion of true positive predictions out of all positive predictions made by the model, while recall measures the proportion of true positive predictions out of all actual positive observations. The F1 score is the harmonic mean of precision and recall and is often used as a single metric to summarize the performance of a binary classifier.
F1 = 2 * (Precision * Recall) / (Precision + Recall)
In cases where a model must make a trade-off between precision and recall, the F1 score provides a more nuanced evaluation of performance than using precision or recall alone. For example, in cases where false positive predictions are more costly than false negatives, it may be more important to optimize for precision, while in cases where false negatives are more costly, the recall may be prioritized. The F1 score can be used to assess the performance of a model in these scenarios and to make informed decisions about how to adjust its threshold or other parameters to optimize performance.
4. Can you explain the use of the Receiver Operating Characteristic (ROC) curve in model evaluation?
The Receiver Operating Characteristic (ROC) curve is a graphical representation of the performance of a binary classification model that plots the True Positive Rate (TPR) against the False Positive Rate (FPR). It helps in evaluating the trade-off between the sensitivity (True Positives) and specificity (True Negatives) of the model and is widely used for evaluating models that make predictions based on binary classification outcomes, such as Yes or No, Pass or Fail, and so on.

The ROC curve is used to measure the performance of a model by comparing the model’s prediction with the actual outcome. A good model will have a large area under the ROC curve, which means that it is able to accurately distinguish between positive and negative classes. In practice, ROC AUC (Area Under the Curve) is used to compare the performance of different models and is a good way to evaluate the performance of models when the outcome classes are imbalanced.
5. How do you determine the optimal threshold for a binary classification model?
The optimal threshold for a binary classification model is determined by finding the threshold that balances the trade-off between precision and recall. This can be done by using evaluation metrics such as the F1 score, which balances precision and recall, or by using the ROC curve, which plots the true positive rate against the false positive rate for various thresholds. The optimal threshold is typically chosen as the point on the ROC curve that is closest to the top left corner, as this maximizes the true positive rate while minimizing the false positive rate. In practice, the optimal threshold may also depend on the specific goals of the problem and the cost associated with false positives and false negatives.
6. Can you discuss the trade-off between precision and recall in model evaluation?
The trade-off between precision and recall in model evaluation refers to the trade-off between correctly identifying positive instances (recall) and correctly identifying only the positive instances (precision). A high precision means that the number of false positives is low, while a high recall means that the number of false negatives is low. However, it is often not possible to maximize both precision and recall simultaneously for a given model. To make this trade-off, you need to consider the specific goals and requirements of your problem and choose the evaluation metric that aligns with them.
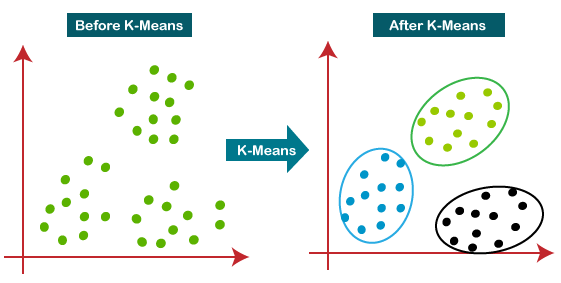
7. How do you evaluate the performance of a clustering model?
The performance of a clustering model can be evaluated using a number of metrics. Some common metrics include:
Silhouette score: It measures the similarity of observation to its own cluster compared to other clusters. The score ranges from -1 to 1, with values closer to 1 indicating a stronger clustering structure.
Calinski-Harabasz Index: It measures the ratio of the between-cluster variance to the within-cluster variance. Higher values indicate a better clustering solution.
Davies-Bouldin Index: It measures the average similarity between each cluster and its most similar cluster. Lower values indicate a better clustering solution.
Adjusted Rand Index: It measures the similarity between the true class labels and the predicted cluster labels, adjusted for the chance. Higher values indicate a better clustering solution.
Confusion matrix: It can be used to evaluate the accuracy of clustering models by comparing the predicted clusters to the true classes.
It’s important to note that choosing the appropriate evaluation metric depends on the specific problem and the goals of the clustering analysis.
8. Can you explain the difference between accuracy, precision, recall, and F1-score in the context of multi-class classification problems?
Here is the comparison between accuracy, precision, recall, and F1-score in the context of multi-class classification problems in tabular format:

9. How do you evaluate the performance of a recommendation system?
Evaluating the performance of a recommendation system involves measuring the effectiveness and efficiency of the system in recommending relevant items to users. Some common metrics used to evaluate the performance of recommendation systems include:
- Precision: The proportion of recommended items that are relevant to the user.
- Recall: The proportion of relevant items that are recommended by the system.
- F1-Score: The harmonic mean of precision and recall.
- Mean Average Precision (MAP): A measure of the average precision of a recommendation system's overall users.
- Normalized Discounted Cumulative Gain (NDCG): A measure of the rank-weighted relevance of the recommended items.
- Root Mean Square Error (RMSE): A measure of the difference between the predicted ratings and the actual ratings for a set of items.
10. How do you handle imbalanced datasets when evaluating a model’s performance?
To handle imbalanced datasets in model evaluation, there are several techniques that can be used:

- Resampling the dataset: This involves either oversampling the minority class or undersampling the majority class to balance the class distribution.
- Using different evaluation metrics: Metrics such as precision, recall, F1-score, and area under the ROC curve (AUC-ROC) are sensitive to class imbalance and can provide a better understanding of the model’s performance on an imbalanced dataset.
- Using cost-sensitive learning: This involves assigning a cost to different types of misclassification, such as assigning a higher cost to false negatives than false positives, to make the model more sensitive to the minority class.
- Using ensemble methods: Techniques such as bagging, boosting, and stacking can be used to improve model performance on imbalanced datasets by combining the results from multiple models.
- Using hybrid methods: A combination of the above techniques can be used to handle imbalanced datasets in model evaluation.
Conclusion
In conclusion, evaluation metrics play a critical role in machine learning by helping practitioners measure and assess the performance of their models. They provide a way to quantify the accuracy, precision, recall, and other aspects of a model’s performance, which can help identify areas for improvement and drive better decision-making. As a result, choosing the right evaluation metric and using it appropriately is essential for ensuring the quality and reliability of machine learning models and the insights they generate.
If you like the article and would like to support me make sure to:
U+1F44F Clap for the story (100 Claps) and follow me U+1F449U+1F3FB Simranjeet Singh
U+1F4D1 View more content on my Medium Profile
U+1F514 Follow Me: LinkedIn U+007C Medium U+007C GitHub U+007C Twitter U+007C Telegram
U+1F680 Help me in reaching to a wider audience by sharing my content with your friends and colleagues.
U+1F393 If you want to start a career in Data Science and Artificial Intelligence and you do not know how? I offer data science and AI mentoring sessions and long-term career guidance.
U+1F4C5 Consultation or Career Guidance
U+1F4C5 1:1 Mentorship – About Python, Data Science, and Machine Learning

Join thousands of data leaders on the AI newsletter. Join over 80,000 subscribers and keep up to date with the latest developments in AI. From research to projects and ideas. If you are building an AI startup, an AI-related product, or a service, we invite you to consider becoming a sponsor.
Published via Towards AI
Related posts


Popular posts

 for 2021")


Updates

Recent Posts


