


 and Python")
Seasonality Detection with Fast Fourier Transform (FFT) and Python
Last Updated on January 6, 2023 by Editorial Team
Author(s): Satsawat Natakarnkitkul
Machine Learning
Quickly detect seasonality using FFT in Python
Forecasting
Forecasting is one of the process of predicting the future based on past and present data. Most of the forecasting problem associated with time series data (i.e. what is the sale of product A next month).
Some problems can be easier to forecast than others. The predictability of an event or a quantity depends on several factors, some are:
- understanding of the factors contribute to the result;
- data availability;
- forecasting technique or learning algorithm.
Often, there are many methods in solving forecast accurately, good forecasts capture the genuine patterns and relationships which exist in the historical data, but do not replicate past events that will not occur again.
Seasonality and use cases
In time series data, seasonality refers to the presence of some certain regular intervals, or predictable cyclic variation depending on the specific time frame (i.e. weekly basis, monthly basis). Some examples of seasonality is higher sales during Christmas, higher bookings during holiday period.
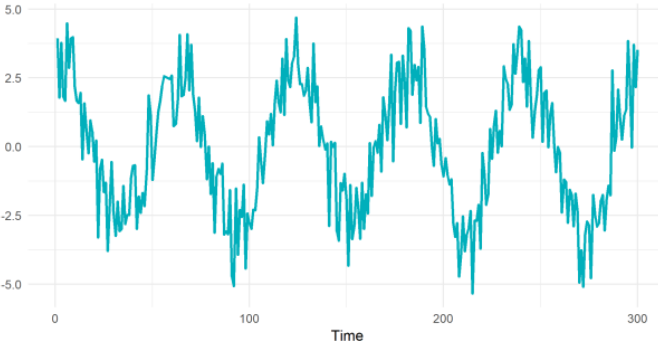
Detecting the seasonality in time series data can improve the forecasting, reveal some hidden insight and lead to insight and recommendation. In general, time series data forecast can be represented onto;
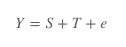
where Y is the metric; S represents seasonality; T represents trends; and e is the error term.
Some key use cases are as followed:
- Top up behavior;
- Specific page, or, application browsing behavior;
- Sales and demand forecasting;
- Temperature forecasting.
There are many approaches to detect the seasonality in the time series data. However, in this post, we will focus on FFT (Fast Fourier Transform).
FFT in Python
A fast Fourier transform (FFT) is algorithm that computes the discrete Fourier transform (DFT) of a sequence. It converts a signal from the original data, which is time for this case, to representation in the frequency domain.
To put this into simpler term, Fourier transform takes a time-based data, measures every possible cycle, and return the overall “cycle recipe” (the amplitude, offset and rotation speed for every cycle that was found).
Let’s demonstrate this in Python implementation using sine wave.
From the script, I have generated the sine wave of 2 seconds duration and have 640 points (a 12 Hz frequency wave sampled at 32 times oversampling factor, which is 2 x 32 x 10 = 640). Then we can compute FT of this data and visualize the output.
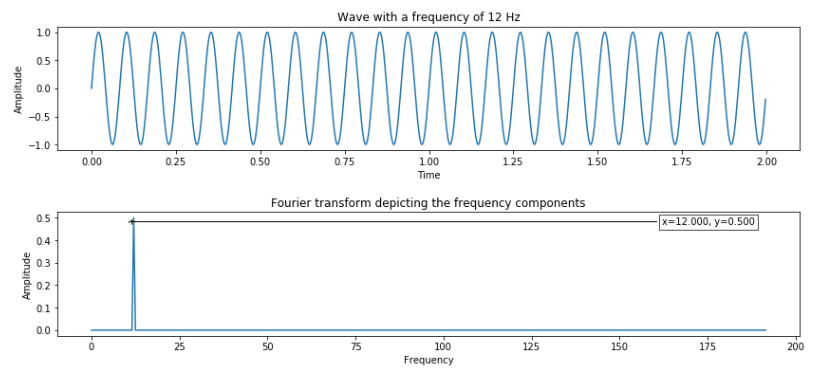
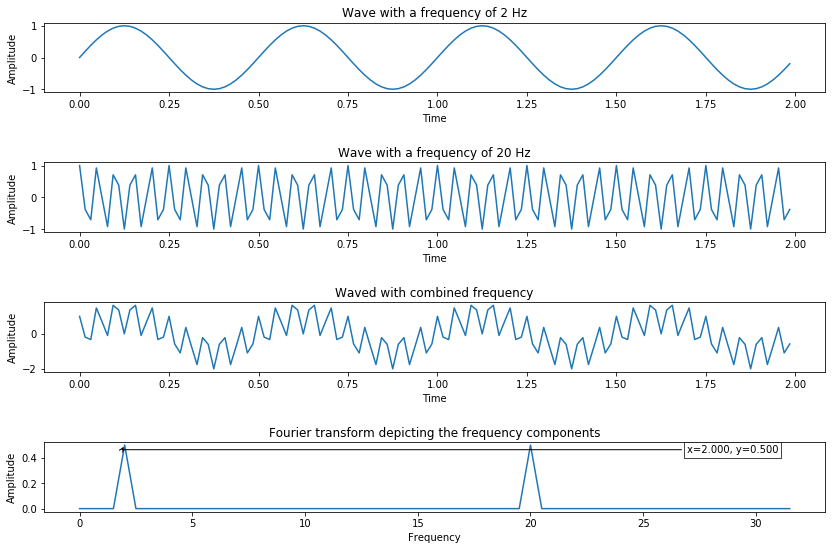
From the result, we can see that FT provides the frequency component present in the sine wave. The next figure shows how we add multiple waves into one and use FFT to detect the peak.
To further demonstrate how FT can help detecting seasonal, the next figure demonstrates how two different waves are combined and used FT to detect the seasonal. FT generates two peaks according to respectively wave Hz.
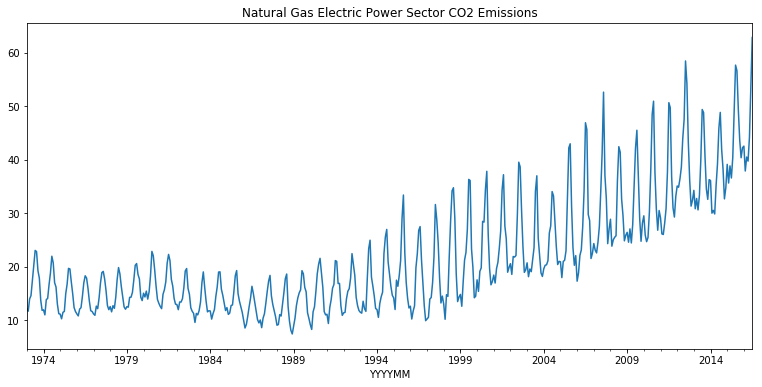
Now, let’s see the implementation on real use cases. In this demonstration, we will detect the seasonality of natural gas CO2 emission.
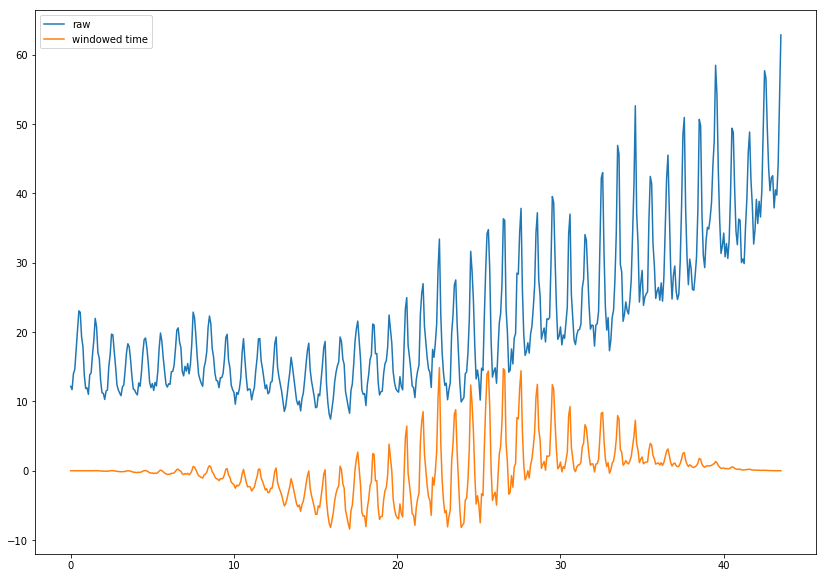
We then normalized the original by subtracting with the median() method and multiplying with window function value (using blackman for this data). Please note that the window function should be suitable with the data set you have, to further study on available window function, you can refer to this to explore different type of window function.
Now we can compute the FT output and plot the graph, the first few frequency bins are being omitted because those points represent the baseline and is not useful for analysis.
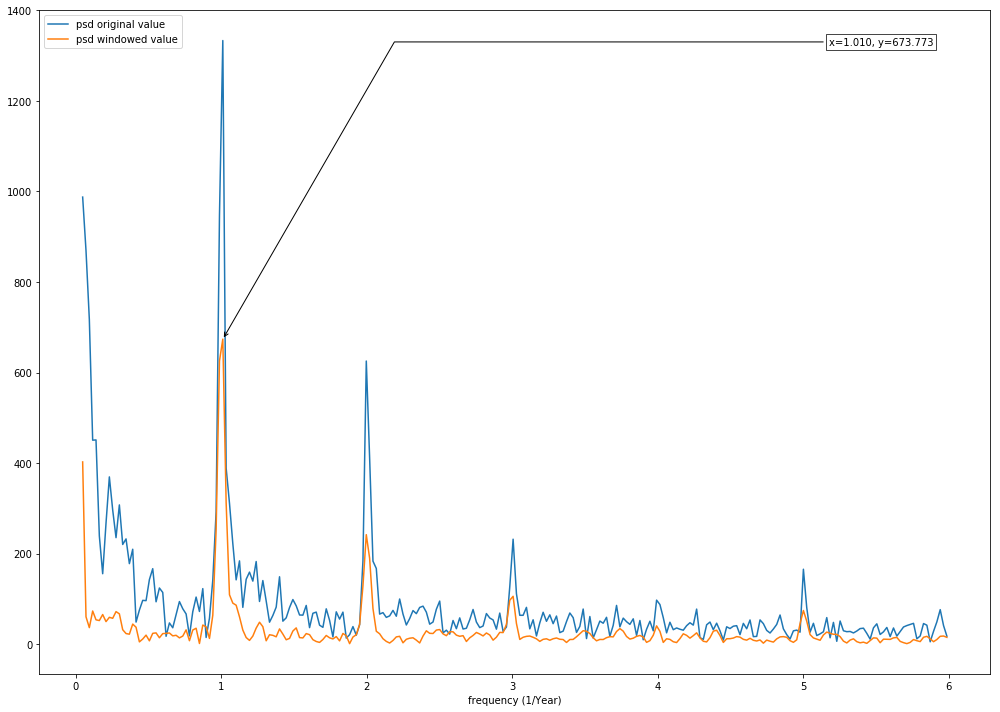
Based on the output, we can see the strong signals at x=1.010, which we can turn this onto year, which is 0.99 year (or 11.89 months, depends on the implementation objective).
End note
As we can see FT can help us capture the seasonality and can be used to decompose the time series data. FFT method is also built in various software package and can easy to use regarding any programming languages.
Thanks for reading and happy learning!!! You can view the notebook with full code implementation here.
- netsatsawat/tutorial_fft_seasonality_detection
- Satsawat Natakarnkitkul – AVP, Senior Data Scientist – SCB – Siam Commercial Bank | LinkedIn
Seasonality Detection with Fast Fourier Transform (FFT) and Python was originally published in Towards AI — Multidisciplinary Science Journal on Medium, where people are continuing the conversation by highlighting and responding to this story.
Published via Towards AI
Towards AI Academy
We Build Enterprise-Grade AI. We'll Teach You to Master It Too.
15 engineers. 100,000+ students. Towards AI Academy teaches what actually survives production.
Start free — no commitment:
→ 6-Day Agentic AI Engineering Email Guide — one practical lesson per day
→ Agents Architecture Cheatsheet — 3 years of architecture decisions in 6 pages
Our courses:
→ AI Engineering Certification — 90+ lessons from project selection to deployed product. The most comprehensive practical LLM course out there.
→ Agent Engineering Course — Hands on with production agent architectures, memory, routing, and eval frameworks — built from real enterprise engagements.
→ AI for Work — Understand, evaluate, and apply AI for complex work tasks.
Note: Article content contains the views of the contributing authors and not Towards AI.
Related posts
Recent Posts


")