


Having a Hard Time Building the Perfect Model?
Last Updated on January 6, 2023 by Editorial Team
Author(s): Davuluri Hemanth Chowdary
Results of a recent study of over 23,000 data professionals found that data scientists spend about 40% of gathering and cleaning data, 20% of their time building and selecting models, and 11% of their time finding insights and communicating them to stakes holders. As a beginner, you might be having a hard time finding the perfect model for your problem statement.
So here I present you PyCaret an open-source and low code machine learning in Python that allows you to go from preparing your data to deploying your model within seconds in your choice of notebook environment.

PyCaret library has everything a data scientist would need.
Quickly let us get into the installation and build a perfect model.
Step 1: Create a Virtual Environment
A virtual environment like python3 virtual environment or Conda environments is recommended to use. So that does not conflict with other packages installed. The advantage of using a virtual environment is we can download a specific version of any library we want to use.
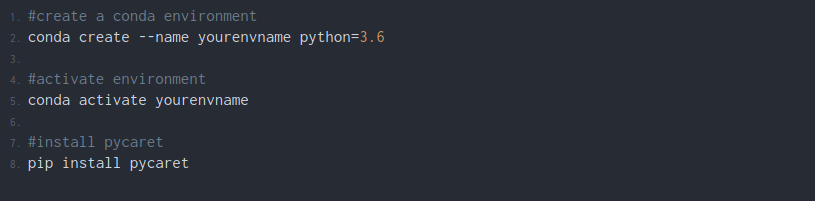
The installation will take around 5 to 10 min depending on your internet speed. If you find any trouble installing the library go through the official documentation(click here).
Step 2: Check if it is installed correctly
- Command Terminal
Activate your conda or python environment in the terminal and then type the following code.
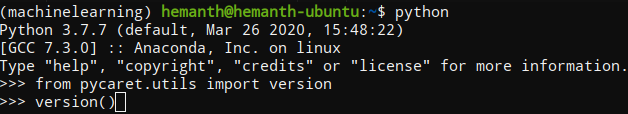
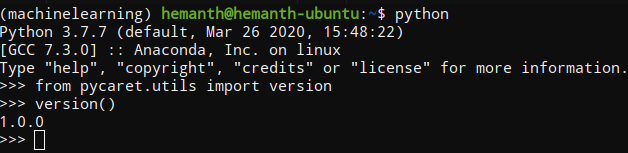
You should get the following output.
I use Ubuntu as my operating system so yours might look different.
2. Jupyter notebook
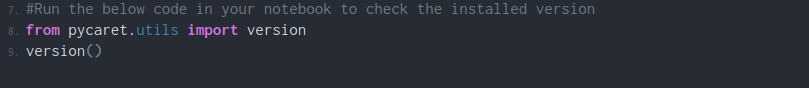
Type the above code and run your jupyter cell. You will get the version number as the output.
Now you have successfully installed the PyCaret library in your machine.
Let me show you how to use it by solving a Regression problem.
Practical Usage
Problem statement:
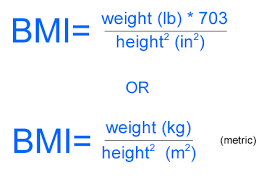
Build a model that can predict the BMI of a person using height and weight as the input features.
General Knowledge
You can get the dataset from the below Github link.
Step 1: Load the data
Note: I used Kaggle notebook environment
Step 2: Split train and test set
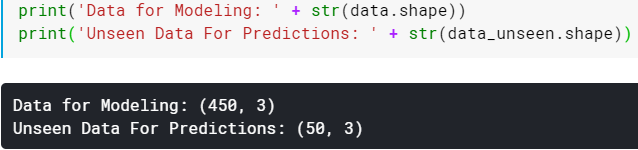
Note: The number of columns in data for modeling is equal to unseen data for predictions and this might look odd for those who are familiar using Sklearn.
There’s nothing to worry PyCaret works this way. You will understand it clearly at the time we predict the unseen data using the trained model.
Step 3: Setting up the Pycaret Environment
The set-up function initializes the environment required for Pycaret to create the transform pipeline for modeling the data and deploy it. Remember the setup function should be called before using any Pycaret functions. The function takes two main arguments data and target. Data is the dataset we are using and the target is the dependent column name. When you run the function a table is created as shown in the below image. If all the data types present in the dataset and shown correctly press enter to continue the experiment. The function performs pre-processing tasks that are needed for any machine learning experiment.

Main keywords definitions that you have to know
- session_id: A random number is created and used for later reproducibility. If you don’t initialize the variable the function automatically assigns 123 as the session id.
- Original Data: Displays the shape of the data set.
- Missing Values: Shows a boolean value if the data is missing in the dataset. True is shown if there is missing data and False is shown if there are no missing values.
- Numeric Features: Number of features inferred as numeric.
- Categorical Features: The number of categorical features count is shown.
- Transformed Train Set: Displays the transformed data frame shape after the pre-processing.
- Transformed Test Set: Displays the shape of the transformed train and test set. The default value is 70 percent for the train set and 30 for the training set.
Step 4: Comparing all the models
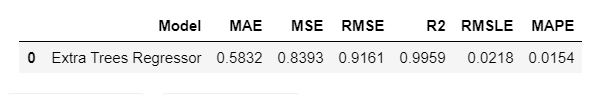
This function call starts comparing all the models based on their performance. This is recommended for modeling the data once the setup is completed. All the models are trained and scores them using k-fold scoring validation for evaluation. The output of this function creates a table with the model name, MAE, MSE, RMSE, R2, RMSLE, and MAPE as the columns. This function call does the hard work and saves a lot of time. Depending on the size of the dataset this step might take time to finish.
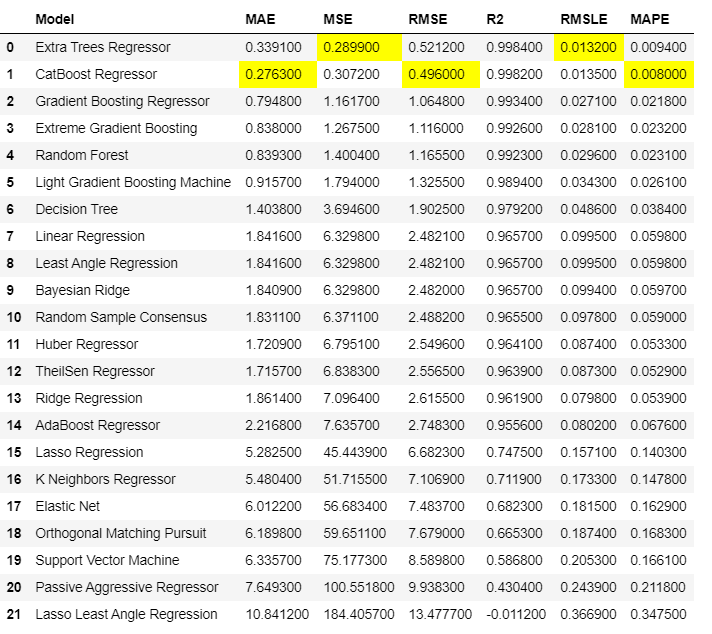
It trained 21 models and arranged them in order from best to the worst. Now it’s your choice to select the best model for you.
The best algorithm that works fine for my problem statement is Extra Tree’s Regressor.
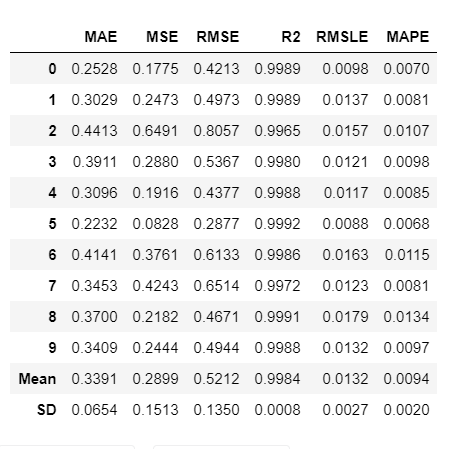
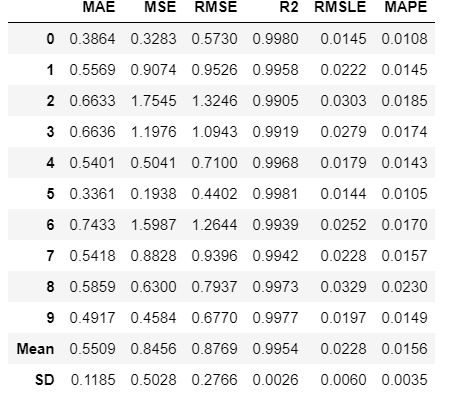
Step 5: Create the model
After comparing models the function does not return the trained models. we have to create the model using create the model function and the function returns a grid with all the scores same as in the above step
You can find all the models described here.
Output:
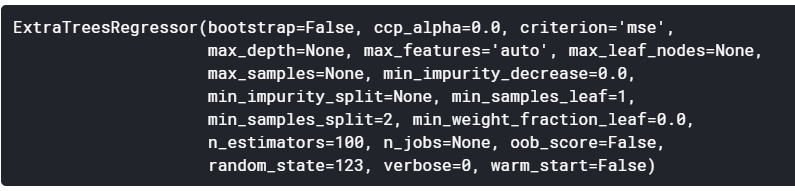
To see all the hyperparameters used in the model print the model using this line of code.
Output:
Step 6: Tune the model
The model created in the above step uses default hyperparameters and the model might not be very effective. So tuning the model is required the tune model function. This function automatically tunes the hyperparameters and scores it using k-fold cross-validation. The output print a grid with all the scores of the tuned model.
Note: tune_model() does not take a trained model object as an input(Abbreviated name of the model as in the creation model function)
Output:
You can print the model and see the tuned hyper-parameters.
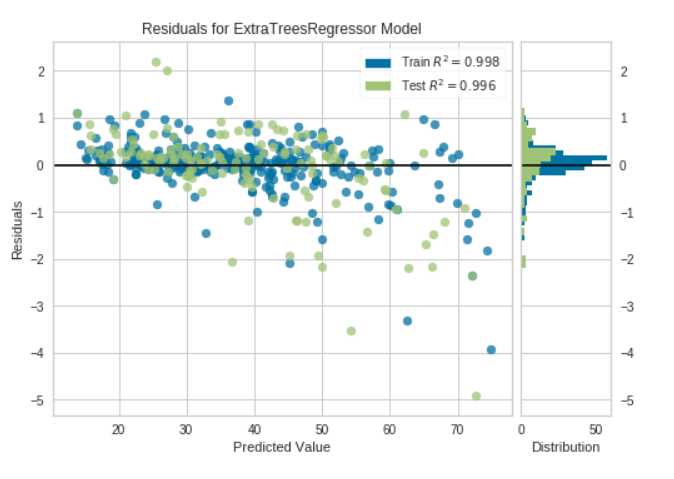
Step 7: Plot the model
Before finalizing, we can plot the model using the plot model function to analyze the performance across different aspects. This function takes a trained model as the argument and returns a plot based on the test set. There are 10 types of plot available for further information go through the documentation.
Output:
There are many other plots which you can try. Go through the documentation.
Step 8: Interactive mode to analyze the model performance
One of the best functions that I found useful in Pycaret is the evaluation model. This function displays a user interface for all the available plots for a given model. plot model function is used to create all the plots internally in this function.
Output:
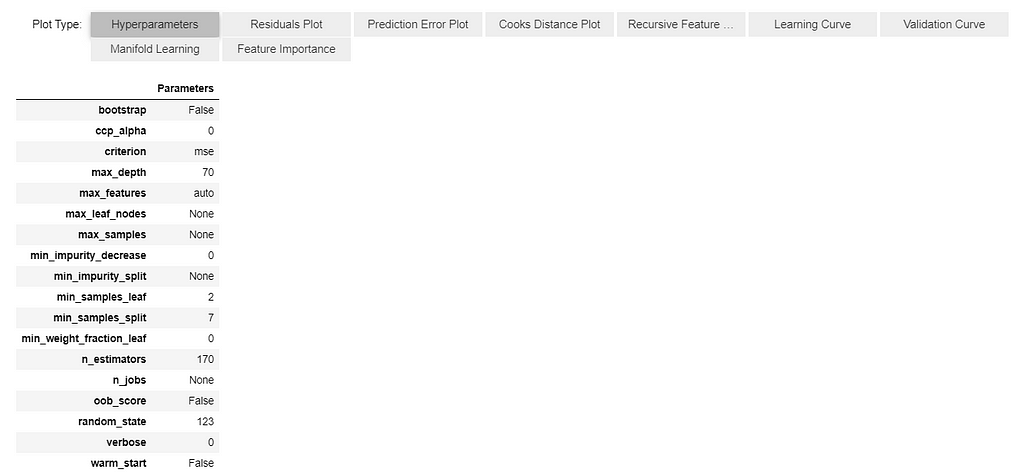
You can select the plot type as this is all interactive.
Step 9: Check the model before finalizing
The main important step of the whole process is checking the model before finalizing it. It is a good practice to perform one final check by prediction test set and evaluating the scores.
Output:
Step 10: Finalize model for deployment
Step 11: Predict to Unseen data
Print the new prediction data frame.
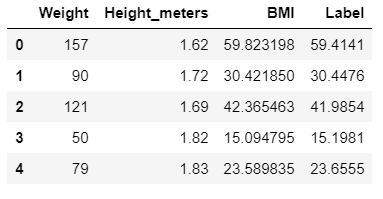
If you keenly look at the data frame you have a new column named “Label” which is nothing but the predicted values column.
I guess now it made sense why there were 3 columns in the unseen data set as train(data) set.
Step 12: Save the model
By doing this you can use your model on new data whenever you want. You need to go through the entire process again if you save your model.
save model function takes two arguments one is the model name and the second one is the name with which you want to save the model.
To reuse the model again try the following code.
Output:

Once the model is loaded in the environment, you can simply use it to predict any new data using the same predict_model() function.
Conclusion
It just took 7 minutes for you to install the library and find a perfect model.
So are you pretty satisfied with PyCaret?
What are you waiting for?
Start implementing your projects and save your precious time as I’m saving mine and writing articles for you.
A follow and clap would be appreciated. Thanks for reading till the end.
See you next time.
Having a Hard Time Building the Perfect Model? was originally published in Towards AI — Multidisciplinary Science Journal on Medium, where people are continuing the conversation by highlighting and responding to this story.
Published via Towards AI
Towards AI Academy
We Build Enterprise-Grade AI. We'll Teach You to Master It Too.
15 engineers. 100,000+ students. Towards AI Academy teaches what actually survives production.
Start free — no commitment:
→ 6-Day Agentic AI Engineering Email Guide — one practical lesson per day
→ Agents Architecture Cheatsheet — 3 years of architecture decisions in 6 pages
Our courses:
→ AI Engineering Certification — 90+ lessons from project selection to deployed product. The most comprehensive practical LLM course out there.
→ Agent Engineering Course — Hands on with production agent architectures, memory, routing, and eval frameworks — built from real enterprise engagements.
→ AI for Work — Understand, evaluate, and apply AI for complex work tasks.
Note: Article content contains the views of the contributing authors and not Towards AI.
Related posts
Recent Posts


")

