


Find features that really explains your data with Kydavra PValueSelector
Last Updated on September 27, 2020 by Editorial Team
Author(s): Vasile Păpăluță
Machine Learning
Features selection is a very important part of machine learning development, It allows you to keep your models as simple as possible keeping at the same time, as much information as possible. Unfortunately, sometimes it can require high mathematical knowledge and good practical skills in programming. However, at Sigmoid we decided to build a library that will make feature selection as easy as implementing models in sci-kit learn.
Using PValueSelector from the Kydavra library.
For those that are there mostly just for the solution to their problem there are the commands and the code:
So to install kydavra just write the next things in the command line:
pip install kydavra
After you cleaned the data, meaning NaN- value imputation, outlayers elimination and, others, you can apply the selector:
from kydavra import PValueSelector
selector = PValueSelector()
new_columns = selector.select(df, ‘target’)
If we will test the result of PValueSelector on the Brazilian houses to rent dataset, we don’t see any growth in the performance of the algorithm. However new_columns contain only 4 columns so, It can be used also on an already well-performing algorithm, just to keep it smaller.
raw_mean_squared_error - 1.0797894705743087
new_mean_sqared_error - 1.0620229254150797
So how it works?
So, before we will dig deeper into what are p-values, we need to understand first what is the null hypothesis.
Null hypothesis is a general statement that there is no relationship between two measured phenomena (or also saying features).
So to find if features are related we need to see if we can reject the null hypothesis. For this we use p-values.
P-value — is the probability value for a given statistical model that, if the null hypothesis is true, a set of statistical observations, is greater than or equal in magnitude to the observed results.
So using the notion above, we can express it more easily, as the probability of finding such observations out of our dataset. So if the p-value is big, then there is a little chance that using this feature in a production model will get good results. That’s why it can sometimes not improve our accuracy, but it can reduce the number of features, keeping our model as simple as possible.
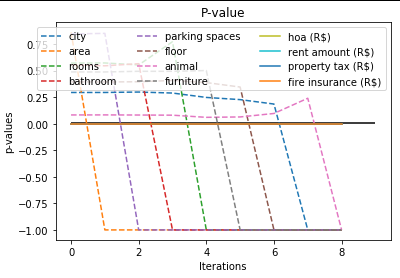
Bonus!
You can see the process of selecting features you can plot it, just running:
selector.plot_process(title=’P-value’)
It has the next parameters:
- title (default = “P-Value Plot”)— the title of the plot.
- save (default = False)— the boolean value, True meaning that it will save the plot, and False not. By default, it is set to false.
- file_path (default = None)— the file path to the newly created plot.
If you want to dig deeper into the notions as Null hypothesis and p-values, or how this feature selection works, bellow you have a list of links.

If you have tried kydavra we invite you to share your impression by filling out this form.
Made with ❤ by Sigmoid.
Useful links:
- https://en.wikipedia.org/wiki/Null_hypothesis
- https://en.wikipedia.org/wiki/P-value
- https://towardsdatascience.com/feature-selection-correlation-and-p-value-da8921bfb3cf
Find features that really explains your data with Kydavra PValueSelector was originally published in Towards AI — Multidisciplinary Science Journal on Medium, where people are continuing the conversation by highlighting and responding to this story.
Published via Towards AI
Towards AI Academy
We Build Enterprise-Grade AI. We'll Teach You to Master It Too.
15 engineers. 100,000+ students. Towards AI Academy teaches what actually survives production.
Start free — no commitment:
→ 6-Day Agentic AI Engineering Email Guide — one practical lesson per day
→ Agents Architecture Cheatsheet — 3 years of architecture decisions in 6 pages
Our courses:
→ AI Engineering Certification — 90+ lessons from project selection to deployed product. The most comprehensive practical LLM course out there.
→ Agent Engineering Course — Hands on with production agent architectures, memory, routing, and eval frameworks — built from real enterprise engagements.
→ AI for Work — Understand, evaluate, and apply AI for complex work tasks.
Note: Article content contains the views of the contributing authors and not Towards AI.
Related posts
Recent Posts


")