


Decision Tree Classification: Explain It To Me Like I’m 10
Last Updated on March 24, 2022 by Editorial Team
Author(s): Shreya Rao
Originally published on Towards AI the World’s Leading AI and Technology News and Media Company. If you are building an AI-related product or service, we invite you to consider becoming an AI sponsor. At Towards AI, we help scale AI and technology startups. Let us help you unleash your technology to the masses.
This is going to be part 4 of the Explaining Machine Learning Algorithms To A 10-Year Old series. We previously discussed a Regression algorithm (XGBoost) and two Clustering algorithms (K-Means and Hierarchical). To switch things up, today we’ll be tackling a classic Classification technique — Decision Trees, an oldie but a goodie.
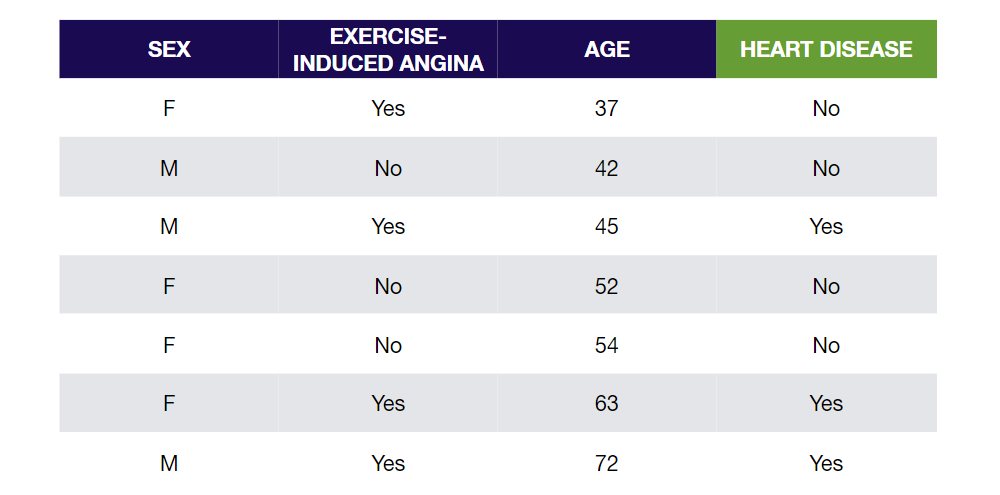
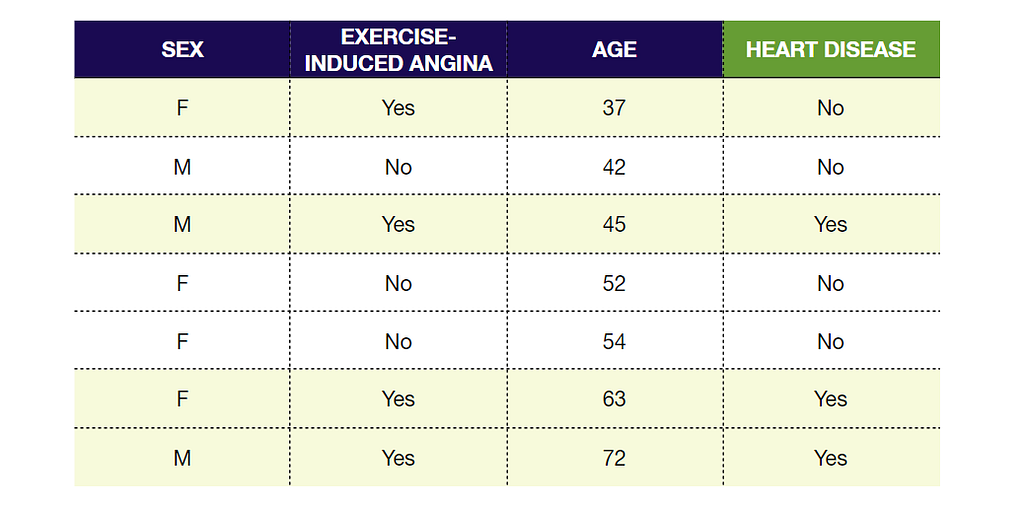
We’ll use a super-simplified training dataset of 7 people to build a Decision Tree that predicts if a person has Heart Disease or not based on their Sex, whether they get Exercise-induced Angina (chest pain during exercise), and their Age.
Step 1: Finding the Root Node
Let’s start with finding the root node of our tree. For edification purposes, we’ll divide the process of finding the root node by variable types.
Categorical Variables
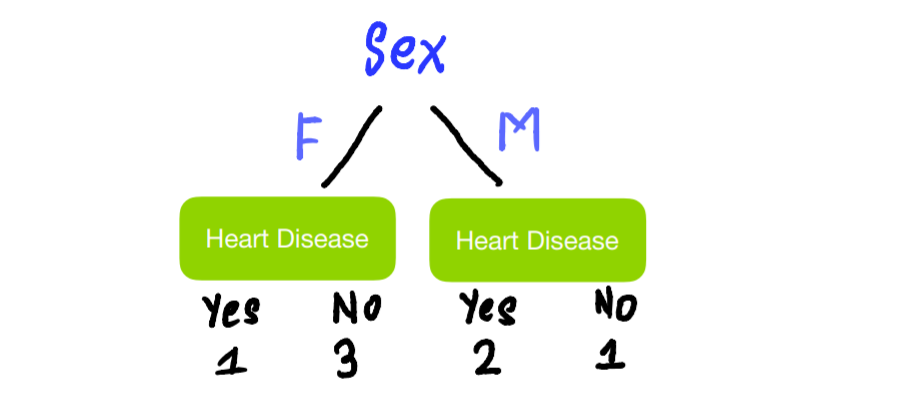
Start by seeing how well Sex predicts whether or not someone has Heart Disease. We do this by setting Sex as our root node and counting how many of the people have and don’t have Heart Disease based on Sex alone.
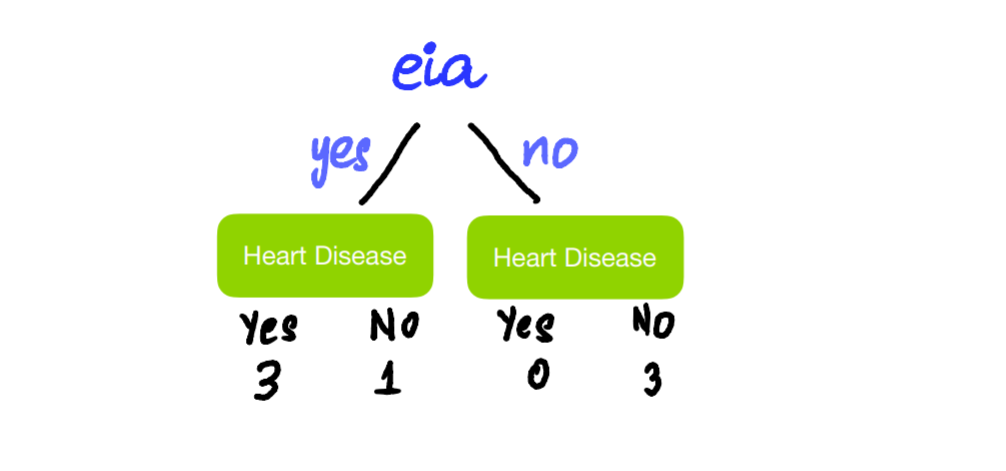
Do the same thing for Exercise-induced Angina:
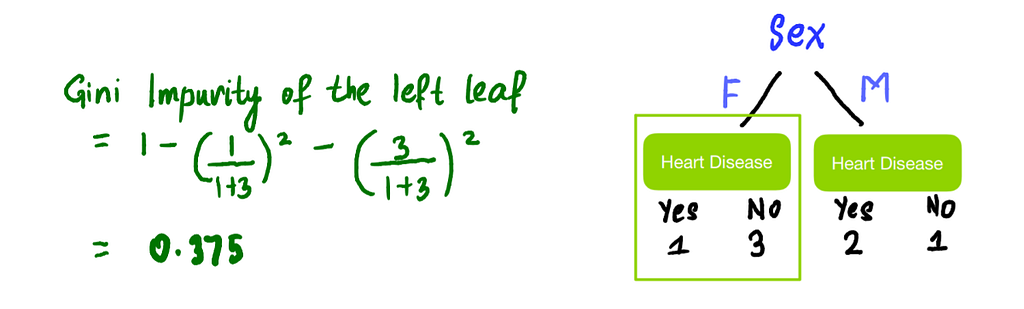
Looking at the trees, we see that neither does a perfect job predicting whether a person has Heart Disease or not. The leaves that contain a mixture of people who have and don’t have Heart Disease are called impure. We can quantify impurity using Gini Impurity, Entropy, and Information Gain. In our case, let’s use Gini Impurity. The higher the Gini Impurity, the more impure the leaves are. So we want the value to be as low as possible. We calculate the Gini Impurity of each of the leaves first, then calculate the total Gini Impurity of the split. The formula to calculate Gini Impurity of leaves is –

Left leaf:
Right leaf:
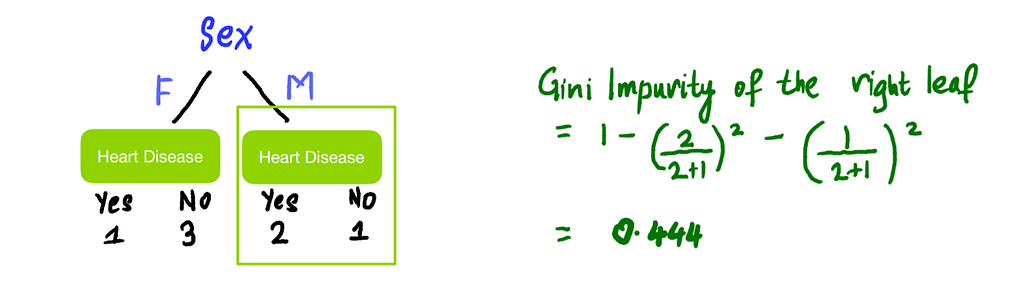
The total Gini Impurity of the split is the weighted average of the Gini Impurities of the leaves. Since the left leaf has 4 people in it and the right has 3 in it:
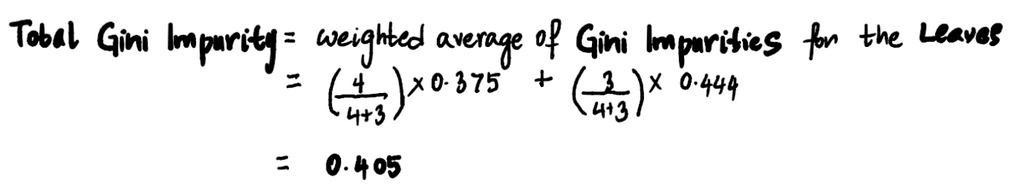
Similarly, using the same formulas above, the total Gini Impurity for Exercise-induced Angina is 0.214.
Continuous Variables
Finding Gini Impurity for continuous variables is a little more involved. First, sort the Age from lowest to highest:
Then calculate the average Age for adjacent rows:
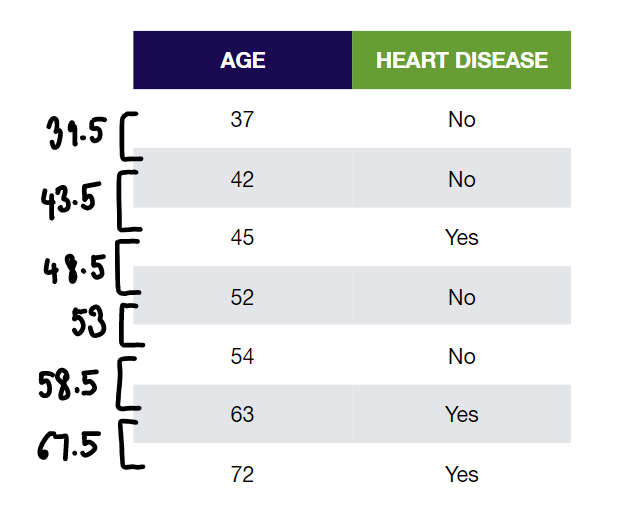
These average ages will be our candidates for root node thresholds. Lastly, we calculate the Gini Impurity values for each average Age. For example, to calculate Gini Impurity for Age < 39.5:

Similarly, Gini Impurities for the rest of the average Ages splits are:
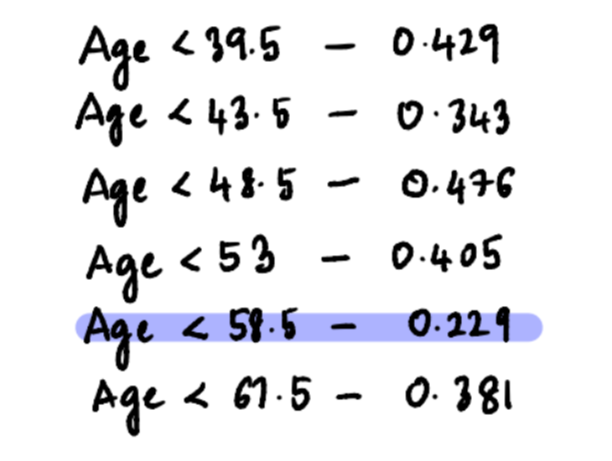
After doing this, the candidate threshold with the lowest Gini Impurity value is Age < 58.5. So, this is going to be the root node candidate for the Age split.
What should the root node be?
Now that we have our three root node candidates, the one with the lowest Gini Impurity is going to be our root node. In this example, Exercise-induced Angina has the lowest Gini Impurity value of 0.214, so that’s what we use.
Step 2: Adding Branches
We add branches to nodes that are impure to reduce impurity. Adding branches pretty much follows the same process as finding the root node. Let’s start by splitting the tree by Exercise-induced Angina, so people who have Exercise-induced Angina go on the left and people who don’t go on the right:
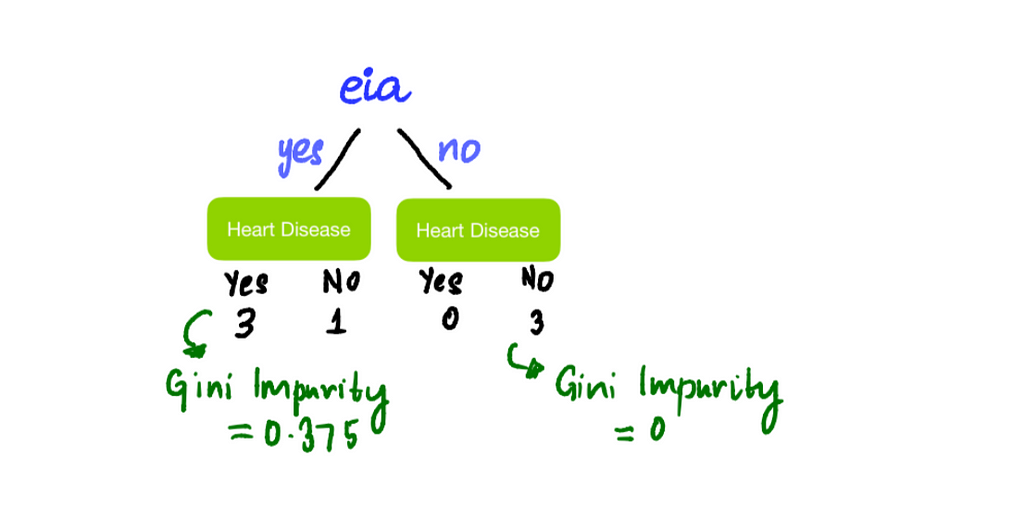
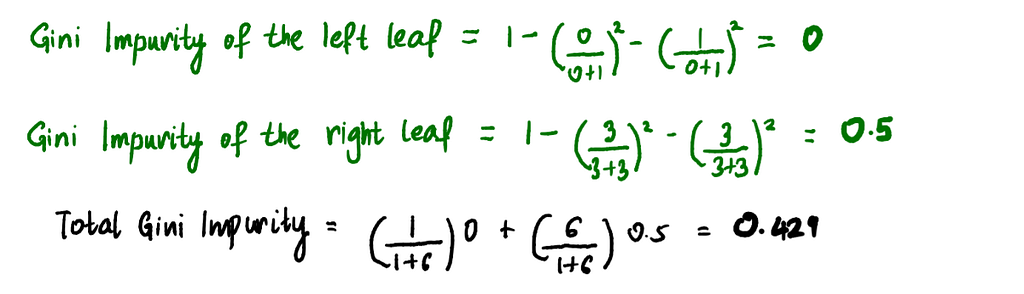
We see that the node on the right is pure with Gini Impurity 0 and the node on the left is impure with Gini Impurity 0.375. Now we check to see if we can reduce the impurity by adding branches or splitting it further by Age or Sex. Since we are only looking at splitting the left node, we should only look at people that have Exercise-induced Angina.
First, try splitting the left node by Sex:
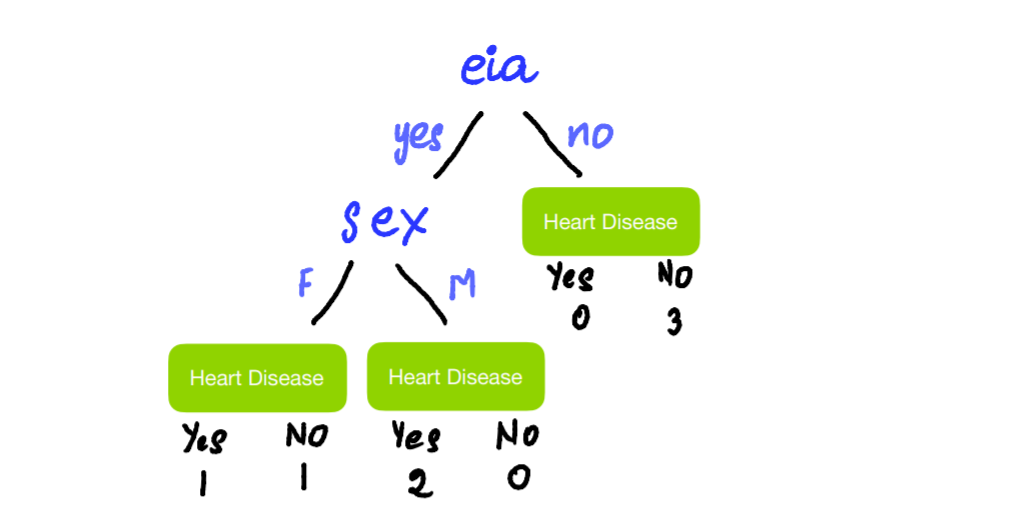
We now calculate the Gini Impurity of the split the same way as before and see that the value is 0.25.
Now, to find the candidate threshold for the Age split, we order the 4 highlighted rows in ascending order and calculate the Gini Impurity for each average age:
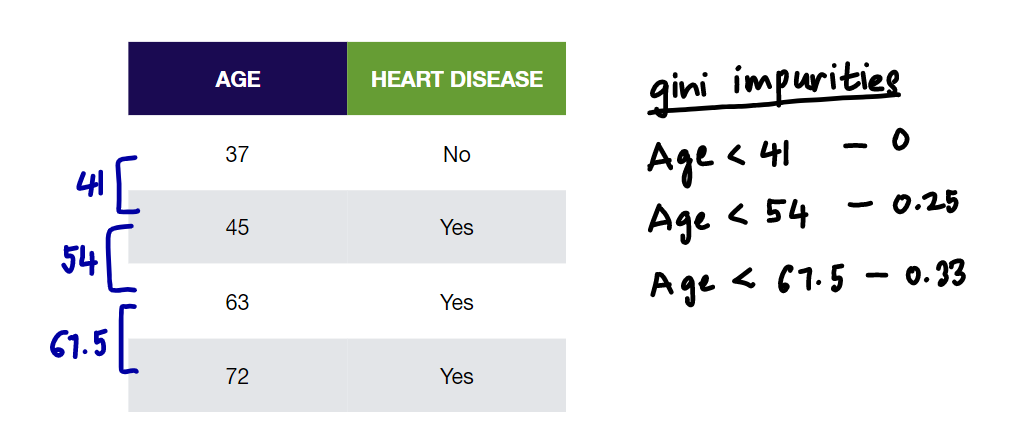
We see that Age < 41 gives the lowest Gini Impurity value of 0. So, this will be our candidate for the Age split. Now because 0 (Gini Impurity of Age < 41 split) < 0.25 (Gini Impurity of Sex split), use Age < 41 to split this node into leaves.
NOTE: We leave the output leaves as leaves because there is no reason to continue splitting these people into smaller groups by adding branches.
Now the tree looks something like this:
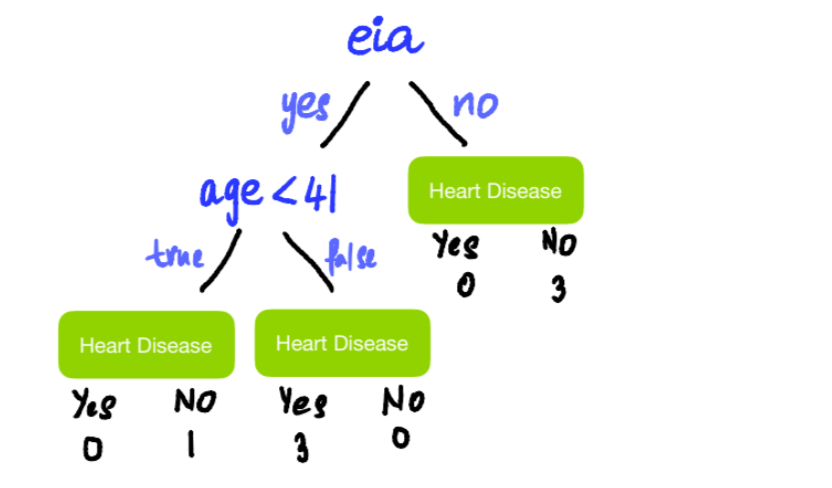
Step 3: Assigning Output Values for Each Leaf
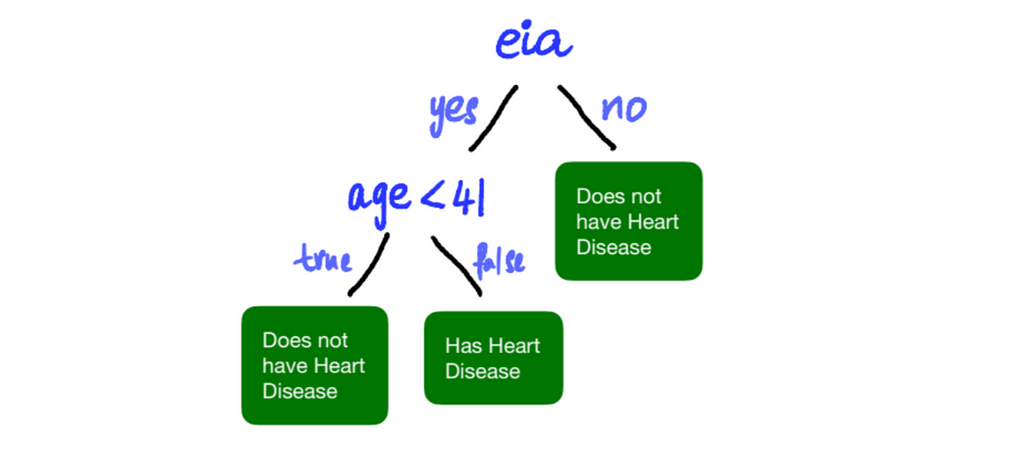
Generally speaking, the output of a Leaf is whatever category has the most votes. In our, case it’ll be whether most of the people in the leaf have Heart Disease or not. So, our final tree is:
Step 4: Checking for Overfitting
Overfitting of data is when a model fits exactly against the training dataset. We ideally want to prevent overfitting of our training dataset because that impacts the model’s performance on new data. A way to avoid this is by pruning the tree. This means that we reduce the size of the tree by getting rid of branches. This can be done in two ways:
- Pre-pruning: Here we prune the tree at the beginning of the model building process by controlling — the maximum depth of the tree, the minimum number of observations required in a node to add branches to the tree, and/or the minimum number of observations required to be in a leaf node.
- Post-pruning: This allows the tree to grow to its full depth, then we remove the branches after.
And that’s it. Your simple, but effective decision tree!
Another shoutout to StatQuest, my favorite statistics, and machine learning resource. Feel free to connect with me on LinkedIn and send me suggestions for any other algorithms that 10-year olds need to understand!
Decision Tree Classification: Explain It To Me Like I’m 10 was originally published in Towards AI on Medium, where people are continuing the conversation by highlighting and responding to this story.
Join thousands of data leaders on the AI newsletter. It’s free, we don’t spam, and we never share your email address. Keep up to date with the latest work in AI. From research to projects and ideas. If you are building an AI startup, an AI-related product, or a service, we invite you to consider becoming a sponsor.
Published via Towards AI
Towards AI Academy
We Build Enterprise-Grade AI. We'll Teach You to Master It Too.
15 engineers. 100,000+ students. Towards AI Academy teaches what actually survives production.
Start free — no commitment:
→ 6-Day Agentic AI Engineering Email Guide — one practical lesson per day
→ Agents Architecture Cheatsheet — 3 years of architecture decisions in 6 pages
Our courses:
→ AI Engineering Certification — 90+ lessons from project selection to deployed product. The most comprehensive practical LLM course out there.
→ Agent Engineering Course — Hands on with production agent architectures, memory, routing, and eval frameworks — built from real enterprise engagements.
→ AI for Work — Understand, evaluate, and apply AI for complex work tasks.
Note: Article content contains the views of the contributing authors and not Towards AI.
Related posts
Recent Posts


")

