Data Visualisation using Pandas and Plotly
Last Updated on July 20, 2023 by Editorial Team
Author(s): Saiteja Kura
Originally published on Towards AI.

Source — Dribbble
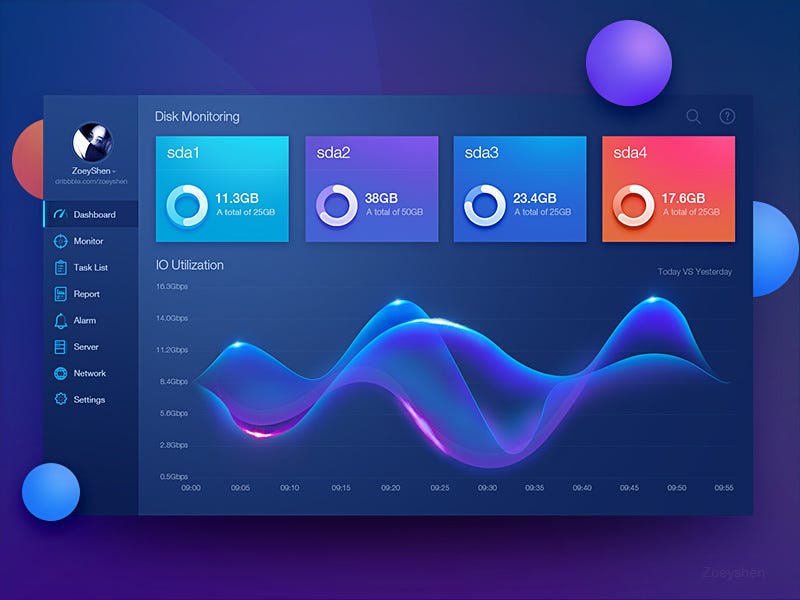
Let us imagine you are trying to convince a client to invest in your company. You exhibit all the employee’s records and their achievements in the form of an excel sheet rather than a bar chart or a pie chart. Imagine yourself in the client’s place. How would you react then? (Wouldn’t too much data be so overwhelming?). This is where data visualization comes into the picture.
Data visualization is the practice of translating raw data into visual plots and graphs to make it easier for the human brain to interpret. The primary objective is to make the research… Read the full blog for free on Medium.
Join thousands of data leaders on the AI newsletter. Join over 80,000 subscribers and keep up to date with the latest developments in AI. From research to projects and ideas. If you are building an AI startup, an AI-related product, or a service, we invite you to consider becoming a sponsor.
Published via Towards AI


