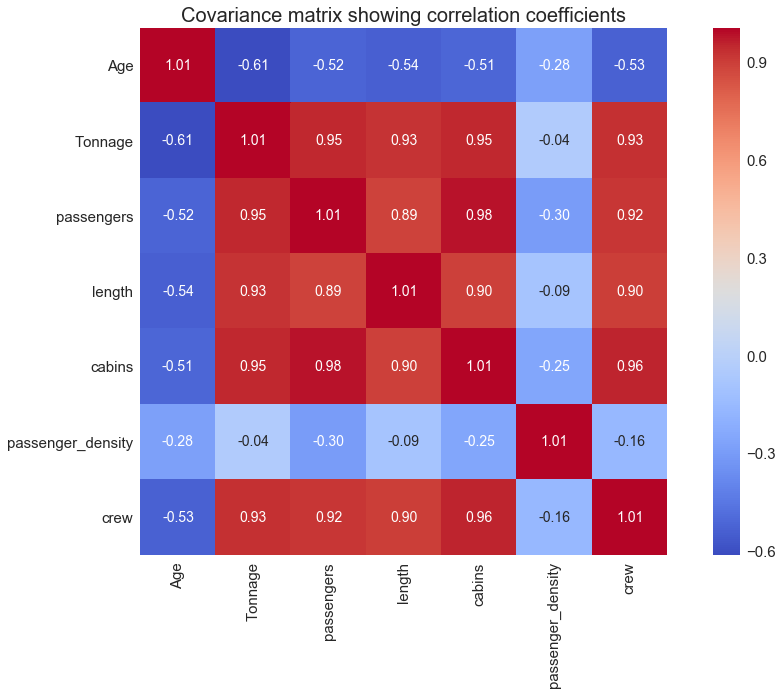
Covariance Matrix Visualization Using Seaborn’s Heatmap Plot
Last Updated on July 20, 2023 by Editorial Team
Author(s): Benjamin Obi Tayo Ph.D.
Originally published on Towards AI.
This tutorial illustrates how the covariance matrix can be created and visualized using the seaborn library

Image by Benjamin O. Tayo
Before implementing a machine learning algorithm, it is necessary to select only relevant features in the training dataset. The process of transforming a dataset in order to select only relevant features necessary for training is called dimensionality reduction. Feature selection and dimensionality reduction are important because of three main reasons:
Prevents Overfitting: A high-dimensional dataset having too many features can sometimes lead to overfitting (model captures both real and random effects).Simplicity: An over-complex model having too many features can be hard to interpret especially when features are correlated with each other.Computational Efficiency: A model trained on a… Read the full blog for free on Medium.
Join thousands of data leaders on the AI newsletter. Join over 80,000 subscribers and keep up to date with the latest developments in AI. From research to projects and ideas. If you are building an AI startup, an AI-related product, or a service, we invite you to consider becoming a sponsor.
Published via Towards AI
Take our 90+ lesson From Beginner to Advanced LLM Developer Certification: From choosing a project to deploying a working product this is the most comprehensive and practical LLM course out there!
Towards AI has published Building LLMs for Production—our 470+ page guide to mastering LLMs with practical projects and expert insights!

Discover Your Dream AI Career at Towards AI Jobs
Towards AI has built a jobs board tailored specifically to Machine Learning and Data Science Jobs and Skills. Our software searches for live AI jobs each hour, labels and categorises them and makes them easily searchable. Explore over 40,000 live jobs today with Towards AI Jobs!
Note: Content contains the views of the contributing authors and not Towards AI.


