


Clustering : What it is? When to use it?
Last Updated on January 6, 2023 by Editorial Team
Last Updated on July 1, 2020 by Editorial Team
Author(s): Daksh Trehan
Machine Learning
Clustering: What Is It and When To use it?
A comprehensive guide to K-Means, K-Means++, and DBSCAN.
Clustering is a Machine Learning technique whose aim is to group the data points having similar properties and/or features, while data points in different groups should have highly offbeat properties and/or features.
Table of Content
1. K-means
⦁ Introduction to K-means
⦁ How K-means work?
⦁ Sci-kit implementation of K-means
⦁ Pros and Cons of K-means
2. K-means ++
⦁ How k-means++ works?
⦁ Sci-kit implementation of K-means++
3. DBSCAN
- How DBSCAN works?
- Pseudocode for DBSCAN
- Sci-kit implementation of DBSCAN
- Pros and Cons of DBSCAN
K-Means
Introduction to K-means
K-means come from a family of unsupervised learning algorithms, where the input is unlabeled unlike that in supervised learning algorithms.
The end goal of K-means is clustering, let’s dive deep into clustering.
Sometimes we just want to organize the data, and that’s where clustering comes into play. It can be used for both labeled as well as unlabeled data.

Everybody has heard about Netflix and its never-ending content compilation.
The content is well organized in different genres such as comedy, drama, thriller, etc.
Now suppose one day you log in to Netflix and archive is cluttered and vague. How cumbersome that would be.
This is the concept of Clustering, grouping all the collateral data point into a cluster for a better and cataloged experience.
This is exactly how K-means works.
Clustering is often found in realms of data analysis, customer segmentation, recommendation systems, search engines, semi-supervised learning, dimensionality reduction, and more.
K-means algorithm is a part of hard clustering, that corresponds that every point belongs only to one cluster.
How K-means work?
The “K” in K-Means denotes the number of clusters. This algorithm is bound to converge to a solution after some iterations.
Goal: Partition data among some “K” number of clusters.
- Initialize K-points.
- Categorize each item to its closest mean.
- Update coordinates of mean that is average of items categorized in mean so far.
- Repeat the above steps until our algorithm converges.
The cost function is :
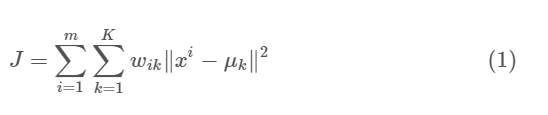
where m = all points
K = all clusters
wik=1 for data point if ith belongs to cluster k;
otherwise, wik=0.
To minimize the loss, we implement coordinate descent. The loss encountered in K-means isn’t convex function therefore there can be multiple local minima.
It’s a minimization problem of two parts:
We first minimize J w.r.t. wik and treat μk fixed. Then we minimize J w.r.t. μk and treat wik fixed.
- E-step: We differentiate J w.r.t. wik first and update cluster assignments (E-step).
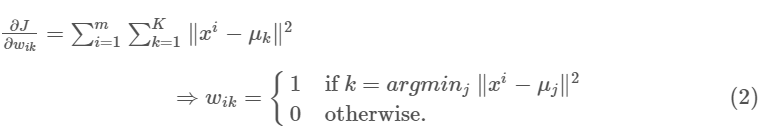
We are assigning the data point xi to the nearest cluster assessed by its Euclidean distance from the cluster’s centroid.
2. M-step: Then we differentiate J w.r.t. μk and re-compute the centroids after the cluster assignments from the previous step.
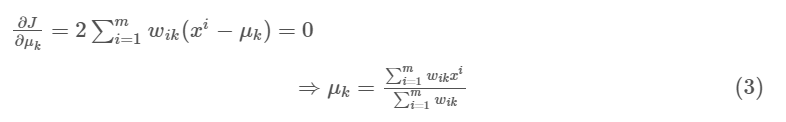
In the nutshell, first, we’ll get wik using E-step and it will classify the point as either 0 or 1. If wik =1 then we will shift to M-step and using μk we get mean of all points to get updated cluster center.

Sci-kit implementation of K-means
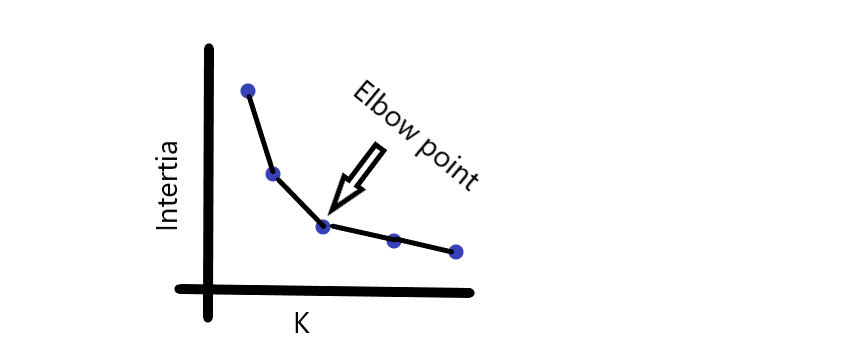
To specify the number of clusters, there are two methods:
- Direct method: Just plot the data points and see if it gives you a hint.
- Value of inertia: The idea behind good clustering is having a small value of inertia, and a small number of clusters.
The value of inertia is inversely proportional to the number of clusters. So, its a trade-off here. Rule of thumb: The elbow point in the inertia graph is an optimal choice because after that the change in the value of inertia isn’t relevant.
Pros and Cons of K-means
Pros:
- Easy to implement.
- Scalable for large data
- Assure convergence.
Cons:
- Sensitive to outliers.
- Picking the number of clusters is a tedious job.
- Initialization is random.
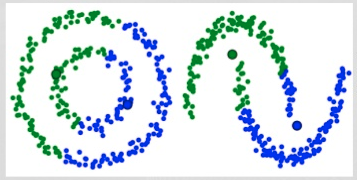
- Not suitable for non-linear data.
K-means++
Introduction to K-means++
K-means++ is an extended variation of K-means. The drawback of K-means was, it used a random initialization technique that often leads to a dysfunctional algorithm, as, once centroids are randomly chosen there is a high risk of being struck into local minima.
K-means++ avoids that hindrance by choosing centroids that are statistically close to real centers.
Sci-kit learn uses k-means++ by default.
Sci-kit implementation for K-means++
But, K-means++ is still not suitable for non linear data points.
DBSCAN (Density-Based Spatial Clustering of Application with Noise)
Introduction to DBSCAN
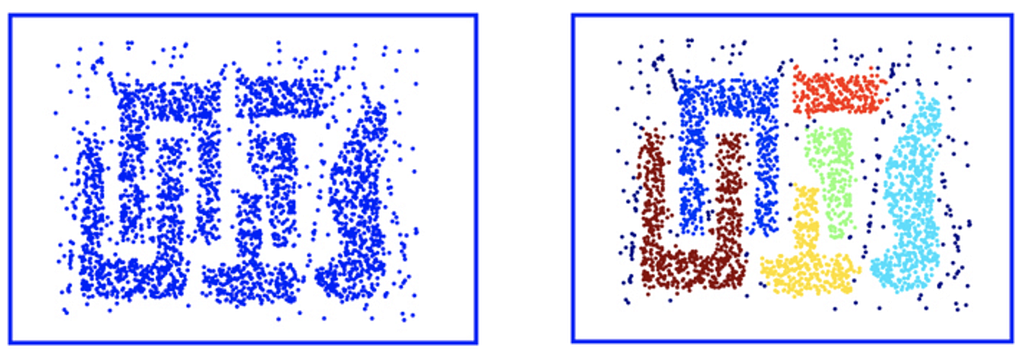
DBSCAN is a clustering solution for non-linear data points.
It is based on the idea that a cluster is a high-density area that is surrounded by low-density regions.
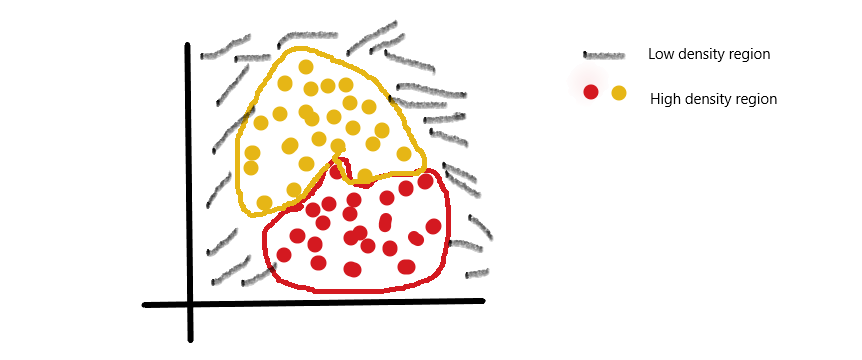
It starts by exploring the small area if the density of that area is “decent enough”, it is considered as part of a cluster and explores neighbor to increase the spatial area of the cluster.
It works on one rule: if the distance of neighbor < threshold distance, then it is added to the family.
Pseudocode for DBSCAN
- Find all the neighbor points within eps and for each core unassigned point, create a new cluster.
- Find recursively all its density connected points and add them to the same cluster as the core point(centroid).
- Repeat the process for an unassigned neighbor.
Sci-kit implementation
Parameters accepted:
eps: It decides how close points should be to each other, to be considered a part of a cluster. It acts as a threshold value.
minPoints: the minimum number of points to form a dense region e.g. if we set the minPoints parameter as 8, then we need at least 8 points to form a dense region(cluster).
Pros and Cons of DBSCAN
Pros of DBSCAN:
- Is great at separating clusters of high density versus clusters of low density within a given dataset.
- Less sensitive to outliers.
Cons of DBSCAN:
- DBSCAN struggles with clusters of similar density.
- DBSCAN is not efficient with high dimensionality data.
- Slower than K-Means.
Conclusion
Hopefully, this article will help you to understand clustering in the best way and also assist you to its practical usage.
As always, thanks so much for reading, and please share this article if you found it useful!
Feel free to connect:
LinkedIn ~ https://www.linkedin.com/in/dakshtrehan/
Instagram ~ https://www.instagram.com/_daksh_trehan_/
Github ~ https://github.com/dakshtrehan
Follow for further Machine Learning/ Deep Learning blogs.
Medium ~ https://medium.com/@dakshtrehan
Want to learn more?
- The inescapable AI algorithm: TikTok
- Why are YOU responsible for George Floyd’s murder & Delhi Communal Riots!!
- Detecting COVID-19 using Deep Learning
- Start-off your ML journey with K-Nearest Neighbors!
- Things you never knew about Naive Bayes!!
- Activation Functions Explained
- Parameters Optimization Explained
- Gradient Descent Explained
- Logistic Regression Explained
- Linear Regression Explained
Cheers!
Clustering : What it is? When to use it? was originally published in Towards AI — Multidisciplinary Science Journal on Medium, where people are continuing the conversation by highlighting and responding to this story.
Published via Towards AI
Towards AI Academy
We Build Enterprise-Grade AI. We'll Teach You to Master It Too.
15 engineers. 100,000+ students. Towards AI Academy teaches what actually survives production.
Start free — no commitment:
→ 6-Day Agentic AI Engineering Email Guide — one practical lesson per day
→ Agents Architecture Cheatsheet — 3 years of architecture decisions in 6 pages
Our courses:
→ AI Engineering Certification — 90+ lessons from project selection to deployed product. The most comprehensive practical LLM course out there.
→ Agent Engineering Course — Hands on with production agent architectures, memory, routing, and eval frameworks — built from real enterprise engagements.
→ AI for Work — Understand, evaluate, and apply AI for complex work tasks.
Note: Article content contains the views of the contributing authors and not Towards AI.
Related posts
Recent Posts


")