


All About Logistic Regression
Last Updated on March 24, 2022 by Editorial Team
Author(s): Akash Dawari
Originally published on Towards AI the World’s Leading AI and Technology News and Media Company. If you are building an AI-related product or service, we invite you to consider becoming an AI sponsor. At Towards AI, we help scale AI and technology startups. Let us help you unleash your technology to the masses.
In this article we will understand Logistic Regression and try to answer the following questions:
- What is Logistic Regression?
- Why not Linear Regression?
- Why Logistic Regression?
- When Logistic Regression?
- How Logistic Regression?
What is Logistic Regression?
Logistic Regression is a Supervised Machine Learning algorithm that is used in classification problems where we have to distinguish the dependent variable between two or more categories or classes by using the independent variables.
For example:
Consider the above table where the dependent variable is ‘Species’ and the independent variable is ‘petal width’. Species show two categories that are ‘0’ denotes Setosa iris flower and ‘1’ denotes Versicolor iris flower.
Logistic Regression will give the probability of the respective category using the petal width of the flower.
Why not Linear Regression?
There are mainly two reasons:
- Linear regression deal with continuous or quantitative values whereas in classification problems we deal with discrete or probabilistic values.
- If we somehow fit the linear regression line into the data set as follows:
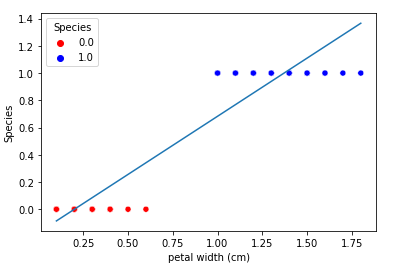
If we take the threshold of 0.5, in this case, the linear line seems to do a good job but if we introduce some outliers in the dataset.
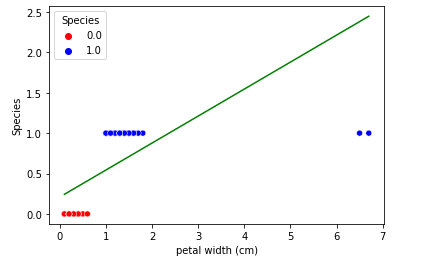
You can see how much the line slope fluctuates from its original position. So we cannot afford such a model which gives different answers when it is introduced with new data points. Another small point to be noticed is that the range of the outcome is not in the range that we want, which is predicting probability outside the range of 0 to 1.
To know more about Linear Regression click on the below link:
Why Logistic Regression?
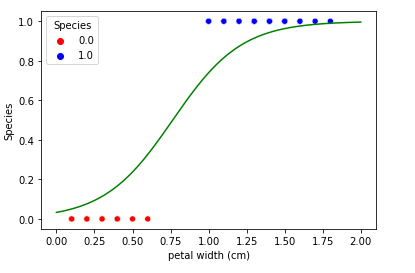
- As we discuss in the above question, linear regression fluctuates when new data points are introduced. Logistic regression solves this problem by introducing an additional function to bend the best fit straight line into a curve shown below.
- Logistic regression is easy to understand, implement, and very efficient to train.
- Logistic regression works well on small datasets and is very fast at classifying unknown records.
- The core concept of logistic regression is further used in Artificial Neural networks.
When Logistic Regression?
When the following requirements are satisfied for logistic regression:
- The dependent variable must be categorical data either be the binary class of data or the ordinal class of data.
- Observation of the independent variables must not be repetitive or matched, cause logistic regression is sensitive to overfitting.
- Multicollinearity should not be there among the independent variables
- Logistic regression typically required large sample size.
NOTE: Above points are also referred to as the “Assumptions for logistic regression”.
How Logistic Regression?
There are two approaches to understanding logistic regression.
- Probabilistic Intuition
- Geometric Intuition
In this article, we will go for Probabilistic Intuition as Geometric Intuition will again cover in SVM (Support Vector Machine).
As we discuss above logistic regression is using a function to squash or bend the linear line that function can be any mathematical function like tan, Sigmoid, ReLu, etc
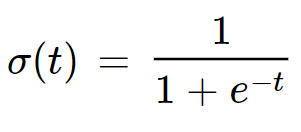
Sigmoidal Function
Logistic Regression mostly use the sigmoid function because-
- sigmoid function return outcome in the range of 0 to 1 which is well suited for logistic regression as we are predicting the probability of the outcome.
- Sigmoid Function derivative is easy to calculate as compared to other function which is used during gradient descent.
Let’s see some relation between the probability of outcome and the linear line equation to better understand the relation between the linear regression and logistic regression:
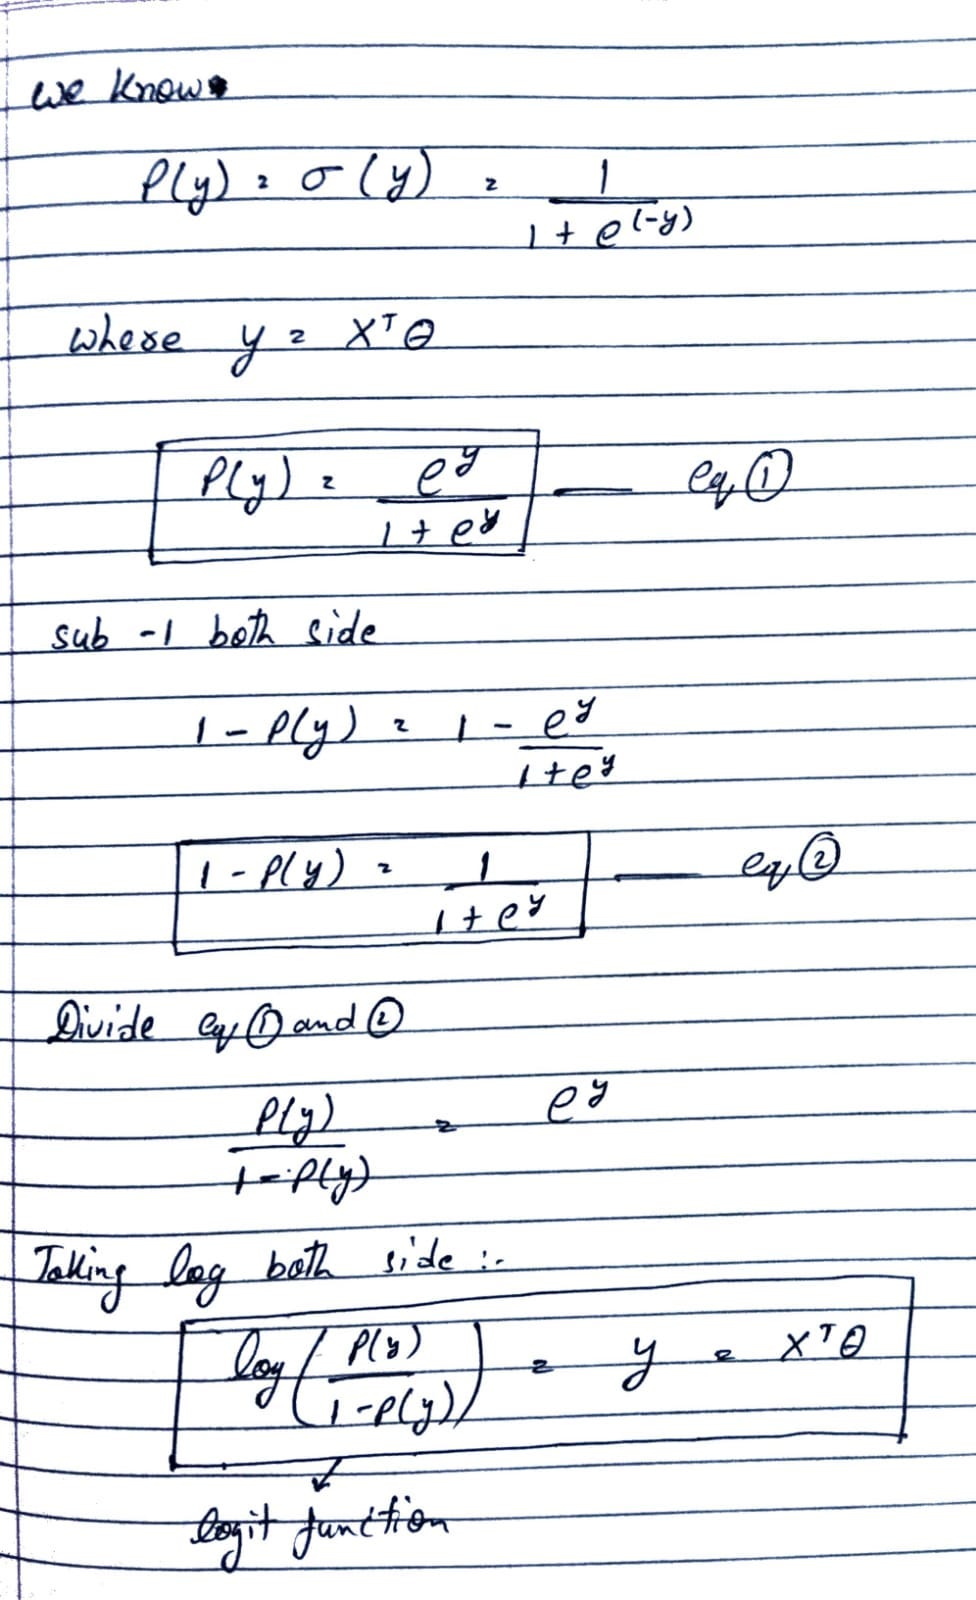
Now, as most supervised machine learning Algorithms, logistic regression also has three main steps: Hypothesis, cost function, an optimization technique.
Hypothesis: In this, we assume some kind of mathematical relationship between dependent and independent variables. In logistic regression, we are using the Sigmoid function to establish the relationship.
Cost function: this function is used to find out the error of our predicted value. In logistic regression, we are using the log loss function.

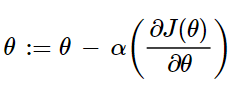
Optimization Technique: In this step, we are trying to reduce the error using some mathematical techniques. In logistic regression, we will use Gradient Descent to do that.
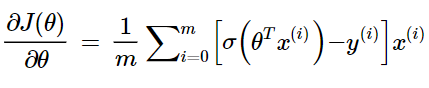
where derivative of the log loss function is:
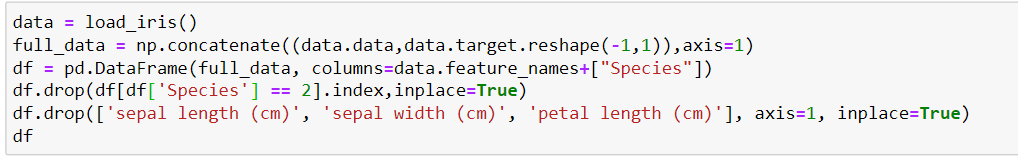
Coding Example of Logistic Regression Using Python from scratch:
Step 1: Preparing the dataset
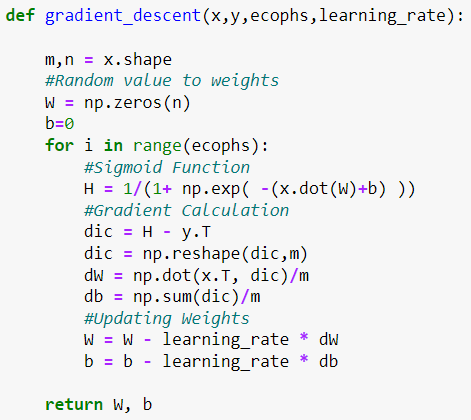
Step 2: Creating a function that performs Gradient Descent and returns the value of weights associated with each independent variable.
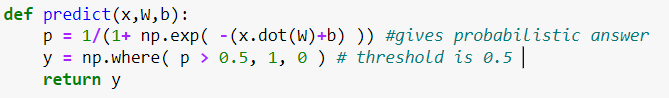
Step 4: Creating a function that predicts the outcome using the weights.
Step 5: Call the functions and predict the outcomes.
How do we know the score or accuracy of the prediction?
In classification problems, we use the confusion matrix, accuracy score, precision, recall, or F1 score to measure the accuracy of the model.
Confusion Matrix:
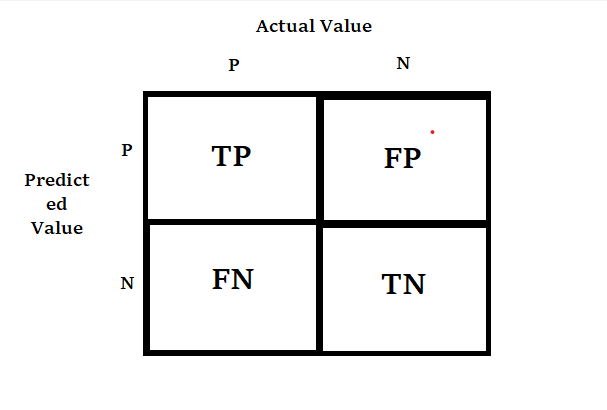
where,
True positive(TP): A result that was predicted as positive by the classification model and also is positive
True Negative(TN): A result that was predicted as negative by the classification model and also is negative
False Positive(FP): A result that was predicted as positive by the classification model but actually is negative
False Negative(FN): A result that was predicted as negative by the classification model but actually is positive.
The Credibility of the model is based on how many correct predictions did the model do.
Accuracy score: The total number of correct classifications divided by the total number of classifications.
Precision: It is a measure of amongst all the positive predictions, how many of them were actually positive
Recall: It is a measure of: from the total number of positive results how many positives were correctly predicted by the model.
F1 Score: It is defined as the harmonic mean of Precision and Recall.
link of the notebook used in this article:
Like and Share if you find this article helpful. Also, follow me on medium for more content related to Machine Learning and Deep Learning.
All About Logistic Regression was originally published in Towards AI on Medium, where people are continuing the conversation by highlighting and responding to this story.
Join thousands of data leaders on the AI newsletter. It’s free, we don’t spam, and we never share your email address. Keep up to date with the latest work in AI. From research to projects and ideas. If you are building an AI startup, an AI-related product, or a service, we invite you to consider becoming a sponsor.
Published via Towards AI
Towards AI Academy
We Build Enterprise-Grade AI. We'll Teach You to Master It Too.
15 engineers. 100,000+ students. Towards AI Academy teaches what actually survives production.
Start free — no commitment:
→ 6-Day Agentic AI Engineering Email Guide — one practical lesson per day
→ Agents Architecture Cheatsheet — 3 years of architecture decisions in 6 pages
Our courses:
→ AI Engineering Certification — 90+ lessons from project selection to deployed product. The most comprehensive practical LLM course out there.
→ Agent Engineering Course — Hands on with production agent architectures, memory, routing, and eval frameworks — built from real enterprise engagements.
→ AI for Work — Understand, evaluate, and apply AI for complex work tasks.
Note: Article content contains the views of the contributing authors and not Towards AI.
Related posts
Recent Posts
")


")


