


Understand Bayes’ Theorem Through Visualization
Last Updated on April 17, 2021 by Editorial Team
Author(s): Satsawat Natakarnkitkul
DATA SCIENCE
Gentle introduction to Bayes’ theorem and why it matters
When we get started out in our machine learning journey, we often asked ourselves whether we should learn statistics and probability or not, especially probability. The answers depend on where you are and how much depth you want to get yourself into understanding it. However, keep these in minds:
- Many algorithms are designed using the concepts, and techniques from probability, i.e. Naive Bayes and Probabilistic Graphical Models;
- many models are trained using an iterative algorithm designed under a probabilistic framework, i.e. maximum likelihood estimation (using frequentist), and maximum posterior estimation (using Bayesian);
- and, the parameters of the models are tuned with a probabilistic framework — Bayesian optimization.
In this article, I will explain Bayes’ theorem concept using visualization and why it is not difficult as some may think.
Bayes’ Theorem as a Visualization …
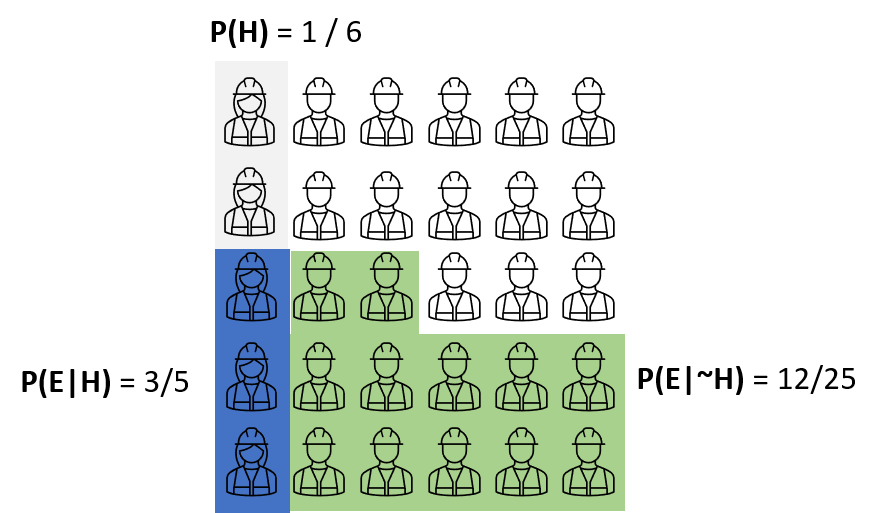
Let’s start with the example in a company with 30 engineers with 25 engineers who are male as per below visualization below.

We can compute the P(female) = 5/30 = 1/6. Consider next statement 50% of these engineers are PhD, which can write P(PhD) = 0.5, with 3 females obtained PhD.
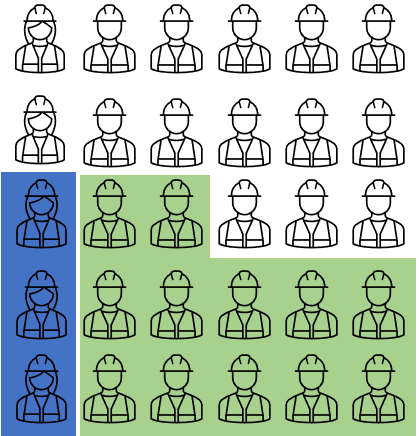
Now, the question we may want to answer is “as we know there are 50% of engineers who have a Ph.D. for a randomly selected individual from this company, what is the probability that this individual is female?”. This question can write into P(female gave Ph.D.) or P(female | Ph.D.). Based on the visualization, that translates into “given Ph.D. as a new universe, what is the probability of female. We can compute using the formula below:

Actually using the above diagram, we can simply calculate by looking at the Ph.D. as a new universe (ignore those with non-PhD) then P(female | Ph.D.) = # no of female / no of Ph.D. engineer (see picture below).
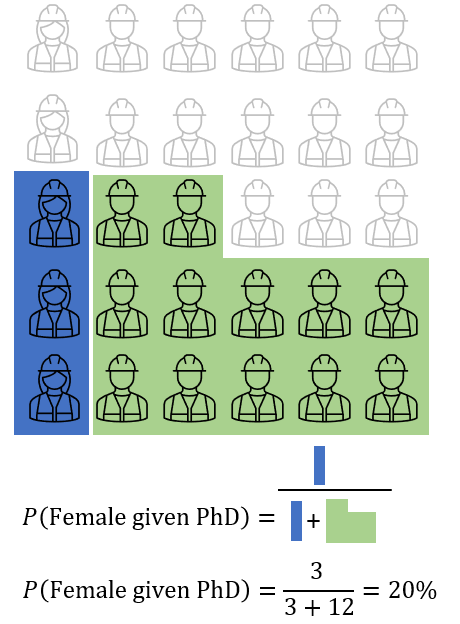
This is actually Bayes’ Theorem.
Fundamental of Bayes’ Theorem
Before going to any definition, normally Bayes’ Theorem are used when we have a hypothesis and we have observed some evidence and we would like to know the probability of the hypothesis holds given that the said evidence is true. Now it may sound a bit confusing, let’s use the above visualization for a better explanation.
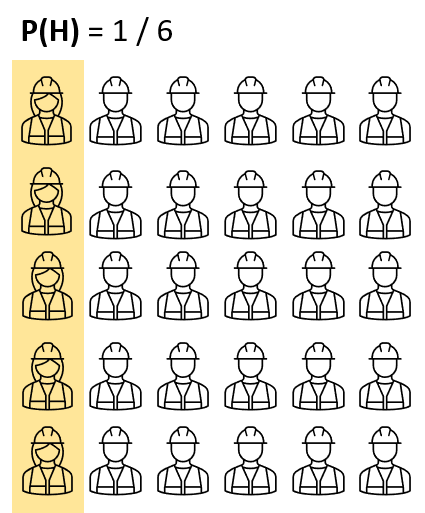
In the example, we want to know the probability of selecting the female engineer given who has finished Ph.D. education.
The first thing we need is the probability of selecting the female engineer from the population without considering any evidence. The term P(H) is called “prior”.
The next relevant number is the proportion when female engineers fit the description (finished Ph.D.), which is P(E|H). In the Bayes’ Theorem, we call this term “likelihood”.
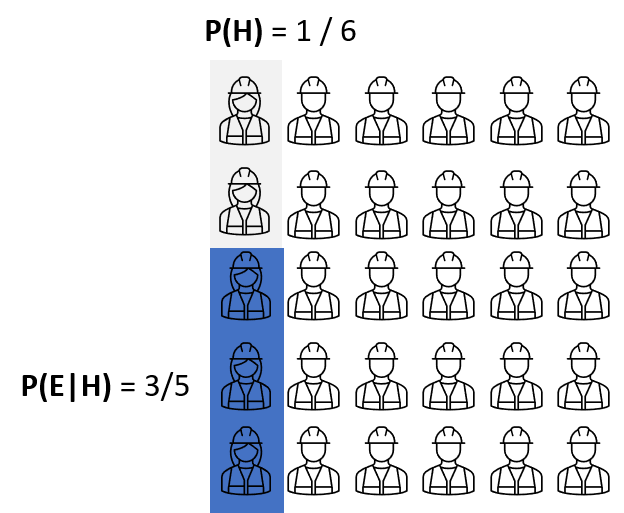
Similarly, we need to know the other sides when the hypothesis is not true.
With this notion, we can compute the probability of a female engineer who holds a Ph.D., P(female| Ph.D.). The denominator can then be written as P(E).
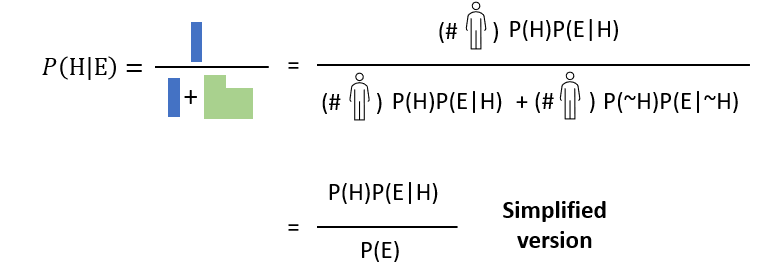
To add one final notion, P(H|E) is called “posterior” in Bayes’ Theorem, which means they believe in the hypothesis after seeing the evidence. Normally, we will use this formula when we analyze the extends of new data to validate and invalidate the model. Bayes’ Theorem helps us quantify and systematize the idea of changing beliefs. This way we can implement Bayes’ theorem onto the machine to validate the beliefs.
The definition…
Bayes’ theorem (or Bayes’ law, Bayes’ rule, Bayes-Price theorem) describes the probability of the event based on prior knowledge of evidence or conditions that may be related to the event. For example, we can use Bayes’ theorem to assess the risk of Covid-19 to an individual of known age to be more accurate (by conditioning it on the individual’s age) than simply assuming that the individual is typical of the population as a whole.
What else?
As we know Bayes’ theorem is branching from Bayesian statistics, which relies on subjective probabilities and uses Bayes’ theorem to update the knowledge and beliefs regarding the events and quantities of interest based on data. Hence, based on some knowledge, we can draw some initial inferences on the system (“prior” in Bayes) and then “update” these inferences based on the data and new data to obtain the “posterior”.
Moreover, there are terms like Bayesian inference and frequentist statistical inference, which is not covered in this article. However, this article should provide you a glimpse on the Bayesian inference, and you should be able to research the frequentist statistical inference on your own.
Conclusion
In this article, I have explained Bayes’ Theorem using visualization and hopefully, you have gained the understanding of;
- What Bayes’ Theorem is and what is it saying?
- When is it useful?
If you have any comments or questions relating to this topic, feel free to reach me via LinkedIn account.
Satsawat Natakarnkitkul – Head of Segmentation – True Digital Group | LinkedIn
Understand Bayes’ Theorem Through Visualization was originally published in Towards AI on Medium, where people are continuing the conversation by highlighting and responding to this story.
Published via Towards AI
Related posts


Popular posts

 for 2021")


Updates

Recent Posts


