


What Is Sampling and Why It’s Important?
Last Updated on November 30, 2021 by Editorial Team
Author(s): Ibrahim Israfilov
Originally published on Towards AI the World’s Leading AI and Technology News and Media Company. If you are building an AI-related product or service, we invite you to consider becoming an AI sponsor. At Towards AI, we help scale AI and technology startups. Let us help you unleash your technology to the masses.
What is sampling and why it’s important?
Intro
This article will cover the basic notions of econometrics and OLS which include the first steps before starting the analysis, namely testing the assumptions for the unbiasedness of OLS. No matter whether you are a data scientist, econometrician, or statistician to know how to have a correct Ordinary Least Squares is the first task you need to undertake.
Random Sampling
Sampling is the action of taking some proportion of the total amount (population) for the non-experimental (not in laboratory) analysis. In statistics, the population is usually denoted by N and the sample by n. Sometimes we have too large a population (let’s say the youngsters in the U.S.A) that we cannot take them all as our dataset so we use the sampling method to get the representation of the whole population.
In this article, we will talk about sampling for linear regressions. The core of the linear regressions is the OLS (Ordinary Least Squares) line which minimizes the variance between squares of all observations in the dataset (Which are taken through sampling). There are several assumptions that should be satisfied in order to have an unbiased OLS.
1. Linear relation
2. Random Sampling
3. E(u|x)=0 Conditional error given the regressor should be 0
4. No perfect collinearity
5. Homoscedasticity
6. Errors should be normally distributed
We will stick today, particularly with the second assumption. We cannot obtain ceteris paribus it’s unpractical, meaning our observations cannot have the regressand difference and other factors equal as an apple-to-apple. So to solve this problem we randomly choose our sample data and later on infer it with statistical techniques in order to represent it for all the population.
Imagine the sampling as the next image which fails our assumption because obviously, it’s not a random sample.
Run a sample in R
Below is one line R code to do it automatically.
sample(1:nrow(data), nrow(data)*0.7)
The sample() function is R built-in function so you don’t need to install other packages.
Whenever you need to have the same results always you need to add the set.seed function before to the code as the next example.
set.seed(1,sample.kind = "Rejection")
don’t forget to run the code together with the set.seed() the sample() function otherwise you will get always different results.
Run a sample in Python
Likely, in Python, you can do the same with sample() function.
from random import sample
data = [1, 2, 3, 4, 5]
print(sample(data,3))
Sampling on Excel
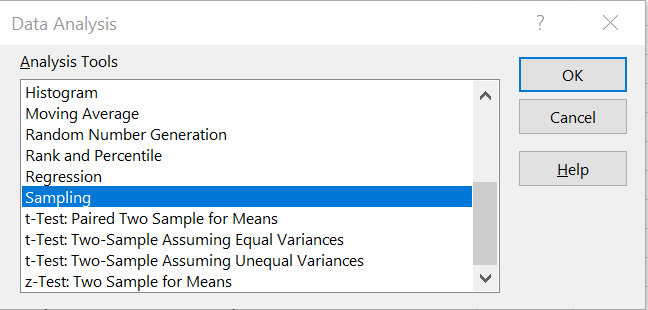
You can even sample your data on excel. In order to do so, you need to use the data analysis tool pack on the ribbon in the data section.

and then choose the sampling.
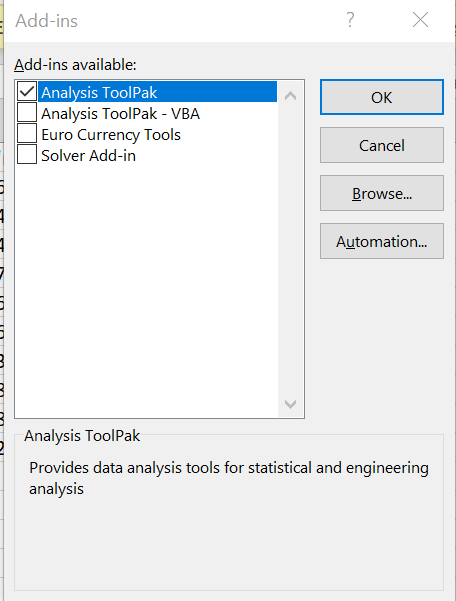
By default, you don’t have a data analysis tool pack on the menu. To add it you need to type on the search bar add-ins

Then you will have an option to incorporate the data analysis tool pack into your menu
Real-Life Example
Imagine you are a new principal of a school and you would love to know whether the free meal program has influenced the GPA of the students or not. Luckily, you have your degree in economics and you had an econometrics class back in your student times. Now what you want to do is to take a sample of students (You have a huge school so can’t take all of them). But you know that not all students are the same. So you remember your econometrics class and the second assumption of the OLS unbiasedness? Let’s go you randomly choose 200 students and start your analysis. You check whether the outcome variable and regressors are linear, you check whether there is heteroscedasticity and whether the errors are normally distributed.
The good news, your all assumptions are correct and you can now run the regression analysis and inference the estimates.
Hope you find it useful. Please share your opinion and critics about this article in the comments. If you are interested in the details of the assumptions I would recommend you to look at the Introduction to Econometrics Book by Wooldridge.
Statistics was originally published in Towards AI on Medium, where people are continuing the conversation by highlighting and responding to this story.
Join thousands of data leaders on the AI newsletter. It’s free, we don’t spam, and we never share your email address. Keep up to date with the latest work in AI. From research to projects and ideas. If you are building an AI startup, an AI-related product, or a service, we invite you to consider becoming a sponsor.
Published via Towards AI
Towards AI Academy
We Build Enterprise-Grade AI. We'll Teach You to Master It Too.
15 engineers. 100,000+ students. Towards AI Academy teaches what actually survives production.
Start free — no commitment:
→ 6-Day Agentic AI Engineering Email Guide — one practical lesson per day
→ Agents Architecture Cheatsheet — 3 years of architecture decisions in 6 pages
Our courses:
→ AI Engineering Certification — 90+ lessons from project selection to deployed product. The most comprehensive practical LLM course out there.
→ Agent Engineering Course — Hands on with production agent architectures, memory, routing, and eval frameworks — built from real enterprise engagements.
→ AI for Work — Understand, evaluate, and apply AI for complex work tasks.
Note: Article content contains the views of the contributing authors and not Towards AI.
Related posts
Recent Posts


")

