


Variance Reduction in Causal Inference
Last Updated on January 17, 2022 by Editorial Team
Author(s): Shweta Baranwal
Originally published on Towards AI the World’s Leading AI and Technology News and Media Company. If you are building an AI-related product or service, we invite you to consider becoming an AI sponsor. At Towards AI, we help scale AI and technology startups. Let us help you unleash your technology to the masses.
Statistics
Many firms, Facebook, Twitter, Google, conduct thousands of experiments every year to make data-driven business decisions, increasing the sensitivity of these experiments allows for more precise decision making. Sensitivity or power is defined as the probability of correctly rejecting the null hypothesis, or in other words, detecting the effect only when there is an effect.
There are many ways to increase the sensitivity of an experiment, including increasing sample size and effect size, using a higher significance level, etc. But increasing the sample size by the factor of four increases the power by a factor of 2, power is proportional to root n.
Since increasing the sample size is not always an option, the other two options to increase the power are as follows:
- a better experiment that has a larger effect size.
- decrease the variance in an experiment without increasing the sample size.
In this article, we will discuss point 2.
Any variability in the experiment would come from an anomaly during the experiment for not controlling the environment correctly or by the actual experimental treatment.
So, how to model and control your variability of the experiment so that you can be sure that your study is able to detect a real effect when it is there?
Here, we will discuss 2 techniques to reduce the variance in the experiment, but before that let’s see how reducing the variance, increases power.
Decrease variance to increase power:
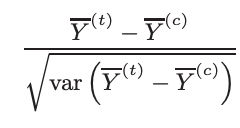
Consider the most common type of statistical test, the two-sample mean t-test based on t-statistic:
Here,
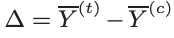
△ is the unbiased estimator of the shift. Because the samples (treatment and control) are independent,
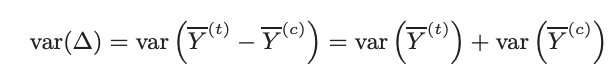
To reduce the variance of estimate delta, we need to reduce the variance of the mean of two samples. We need to find an adjusted delta △* such that,
a) △* is an unbiased estimator of shift (same as △)
b) var(△*) < var(△)
Reducing the variance will increase the value of t statistic therefore more likely to reject the null hypothesis for the same effect size as before thus increasing the power.
Now, let’s talk about the two techniques of reducing the variance of observed Y in the two samples.
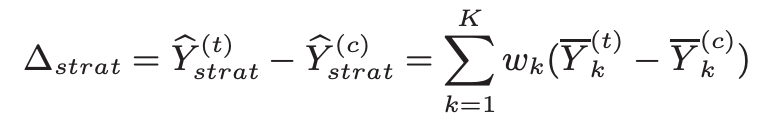
Technique 1: Stratification
The underlying concept here is to divide the sample into strata and then compute mean and variance from each stratum to get an overall estimate. The mean of the stratified sample is also an unbiased estimator of a population mean and the variance of the mean of the stratified sample is less than the variance of the random sample means. Proof below:
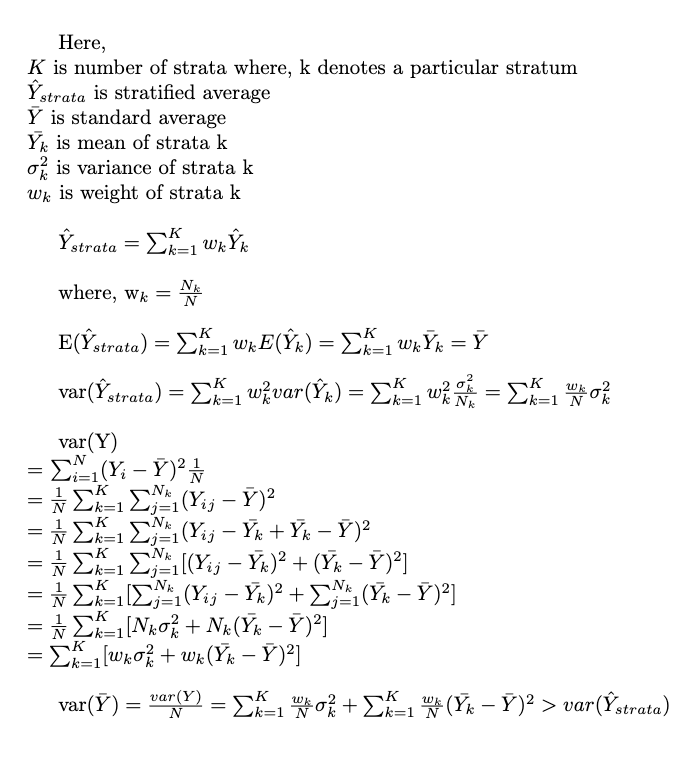
In the online experiment, we can use pre-experiment data (covariate) to form these strata. It is important to take pre-experiment covariate to form underlying strata because this way it will not introduce bias in the stratified delta because the strata are unaffected by the treatment effect. A good stratification is one that aligns well with the underlying clusters in the data so choose the covariate well.
For example, if Yi is the number of queries from user i, a covariate Xi could be the browser that the user used before the experiment started.
Technique 2: Control variate
Here we simulate a new variable Y_cv such that it is an unbiased estimator of Y and have a lower variance than Y. To achieve this, we use a random variable X with known E(X) such that we have independent pairs of (Yi, Xi), i = 1, . . . , n. Define:

where mean and variance of Y_cv is:

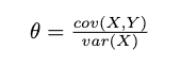
As we see Y_cv is an unbiased estimator of a population mean and in order to minimize variance we set 𝛉 as:

After substituting this 𝛉 in the variance equation,

where, 𝞺 = cov(X, Y)
The variance is reduced by the factor of 𝞺². The larger the 𝞺, the better is variance reduction. So, we need to find a covariate X with known E(X) which is highly correlated with Y.
Applying this back to the delta operator we get,

given,
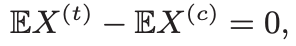
It is important for the above equation to hold to get delta as an unbiased estimator of shift. Also, X is a pre-experiment covariate which means it is unaffected by treatment effect, so randomization for control and treatment group ensures that the two expectations are equal.
So now how to get this pre-experiment, known E(X) and highly correlated with Y, covariate? One of the ways is to get the same covariate as Y during the pre-experiment observation phase. Let’s say, the experiment is to observe the impact on CTR after making changes in the recommendation engine. In this case, the covariate can be the user’s CTR on the platform before the experiment started.

Other than selecting an appropriate covariate there are other factors that impacts the result, for example:
- How long the experiment will run? Sometimes running the experiment for too long brings new or lapsed users into the experiment for whom the matching corresponding covariate X in pre-experiment data will be missing which reduces the experiment coverage.
- Range of pre-experiment duration. How far do we need to go back in the pre-experiment period to get the covariate X? Too short a period will lead to poor matching, whereas too long a period will reduce correlation with the outcome metric during the experiment period.
Both techniques are helpful in reducing the variance and hence the sensitivity of the experiment. The second technique is also famously called CUPED, Controlled-experiment Using Pre-Experiment Data. There are cases when the two methods are closely related and exhibit the same results. For more details on the topic, refer to the resources below.
Code
Medium-Posts/variance_reduction.ipynb at master · ShwetaBaranwal/Medium-Posts
Resources
- https://exp-platform.com/Documents/2013-02-CUPED-ImprovingSensitivityOfControlledExperiments.pdfhttps://www.kdd.org/kdd2016/papers/files/adp0945-xieA.pdf
- https://medium.com/swlh/why-sample-size-and-effect-size-increase-the-power-of-a-statistical-test-1fc12754c322
- https://towardsdatascience.com/online-experiments-tricks-variance-reduction-291b6032dcd7
Variance Reduction in Causal Inference was originally published in Towards AI on Medium, where people are continuing the conversation by highlighting and responding to this story.
Join thousands of data leaders on the AI newsletter. It’s free, we don’t spam, and we never share your email address. Keep up to date with the latest work in AI. From research to projects and ideas. If you are building an AI startup, an AI-related product, or a service, we invite you to consider becoming a sponsor.
Published via Towards AI
Towards AI Academy
We Build Enterprise-Grade AI. We'll Teach You to Master It Too.
15 engineers. 100,000+ students. Towards AI Academy teaches what actually survives production.
Start free — no commitment:
→ 6-Day Agentic AI Engineering Email Guide — one practical lesson per day
→ Agents Architecture Cheatsheet — 3 years of architecture decisions in 6 pages
Our courses:
→ AI Engineering Certification — 90+ lessons from project selection to deployed product. The most comprehensive practical LLM course out there.
→ Agent Engineering Course — Hands on with production agent architectures, memory, routing, and eval frameworks — built from real enterprise engagements.
→ AI for Work — Understand, evaluate, and apply AI for complex work tasks.
Note: Article content contains the views of the contributing authors and not Towards AI.
Related posts
Recent Posts
")


")


