


Unlocking the Black Box: A Comparative Study of Explainable AI Techniques: PDP vs. ALE and, SHAP vs. Breakdown
Last Updated on July 17, 2023 by Editorial Team
Author(s): Varsha Singh
Originally published on Towards AI.
Let us get a grip on the inner working of a few popular XAI Techniques with Easy-to-Understand Explanations.
As a data scientist, understanding the inner workings of our models is crucial. This instills confidence in the analytics solution and gives comfort to the stakeholders. But what happens when our models become too complex to interpret? Enter explainable AI, a field dedicated to interpreting and understanding the decisions made by our models. In this exploration, we’ll be taking a closer look at two of the most popular global explanation methods: Partial Dependence and Accumulated Local Effects, which help us understand the relationship between input and output variables. And we’ll also be comparing two local explanation techniques: SHAP Waterfall Plots and Breakdown Interaction Plots. Each of these techniques offers unique insights that are crucial to understanding our models. Let’s start exploring!
1. Introduction
I recently wrapped up an incredible internship where I was able to delve into cutting-edge research and development projects, one of which involved exploring and comparing various explainable artificial intelligence (XAI) techniques. The work has been compiled into a comprehensive notebook for sharing, which details each aspect of the project using the Stroke Prediction Dataset. The insights and lessons learned have been condensed into the included explanations.
XAI family of packages out there
Below is a table of the most popular XAI packages and frameworks, including offerings from big brands such as IBM, Google, Microsoft, etc. Please head on over to my git for quick and easy access to each reference.

2. Partial Dependence Plot vs. Accumulated Local Effects
This section provides a succinct overview of Partial dependence and accumulated local effects — two techniques for providing global explanations in machine learning. These methods help clarify how a model’s predictions alter as individual feature values shift. A simple demonstration has been created to help illustrate their application and make understanding easier. The aim is to give you a comprehensible understanding of how these methods operate and how they can be utilized to gain a deeper insight into a model’s predictions.
2.1 PDP
The Partial Dependence Plot (PDP) is a widely used method for interpreting machine learning models. It provides insight into the relationship between a feature and the target variable by visualizing the marginal effect that a feature has on the predicted outcome. The PDP is model-agnostic, which means that it can be used with any type of machine-learning model.

The PDP allows us to determine whether the relationship between the target and a feature is linear, monotonic, or more complex. This information can be used to improve the model or to gain a deeper understanding of the data. This information can also be used to validate the efficacy of the data and make sure it aligns with what the business/ domain experts expect.
How is partial dependence calculated?
The idea is to observe the model’s output when the feature is varied over a certain range while all other features are held constant. The concept of PDP is explained in great detail by Christoph Molnar in his book Interpretable Machine Learning.
A sample dataset has been created to exhibit the computation of Partial Dependence (PDP) for a single feature. The dataset includes four features: age, bmi, heart disease (coded as 0 for patients without heart disease and 1 for patients with heart disease), and the predicted probability of stroke as determined by a machine learning model.
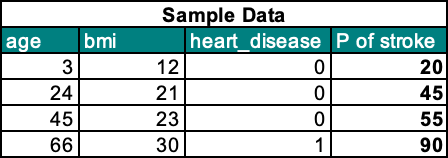
Please note that this data is just for example purposes and is not representative of any real-world scenario. The purpose of this exercise is to demonstrate the calculation of Partial Dependence (PDP) for a single feature.
Our aim is to calculate the PDP for the feature ‘age’ and its impact on the target variable ‘stroke’. To calculate partial dependence, we need to follow these steps:
1. Define a grid: To calculate PDP, we first define a grid of values for the feature of interest. The grid should have a range that covers the possible values of the feature. In our example, the grid for the feature “age” is [3, 24, 45, 66].
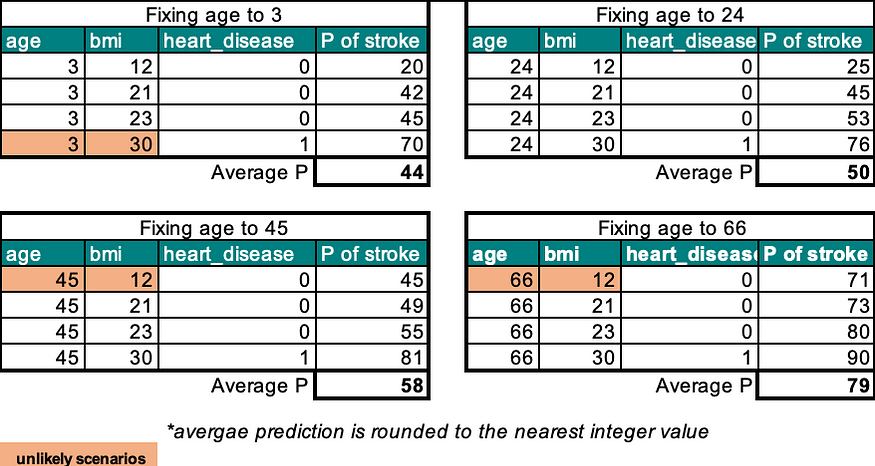
2. Replace feature value with grid value: For each value in the grid, we replace the feature value in the data with the grid value. In this case, we replace the age of all observations with a value in the grid.
3. Take the average of predicted values: For each grid value, we run the model and obtain the predicted value. We then take the average of the predicted values over all observations. This gives us the average predicted value for each grid value.
4. Map out the partial dependence plot: We use the average predicted values obtained in the previous step to create a partial dependence plot. This plot shows the relationship between the feature and the target variable. The PDP for feature age can be represented as a line graph, where the x-axis is the age values defined in the grid, and the y-axis is the average of the predicted probabilities of having a stroke. This plot shows how the prediction of the probability of having a stroke changes as the value of age changes. The plot helps to understand the relationship between the feature age and the target variable, i.e., probability of having a stroke.
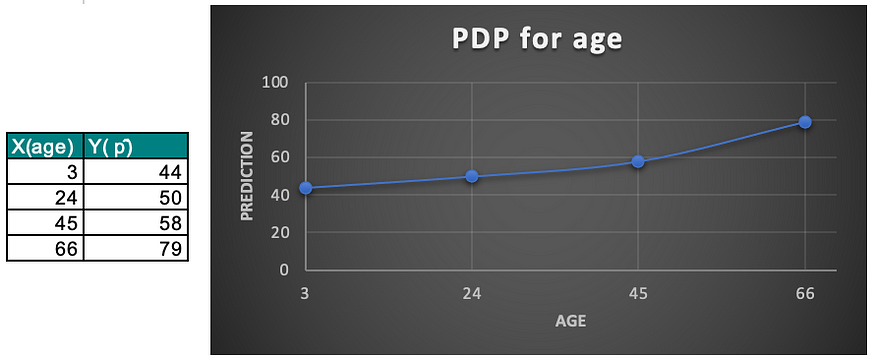
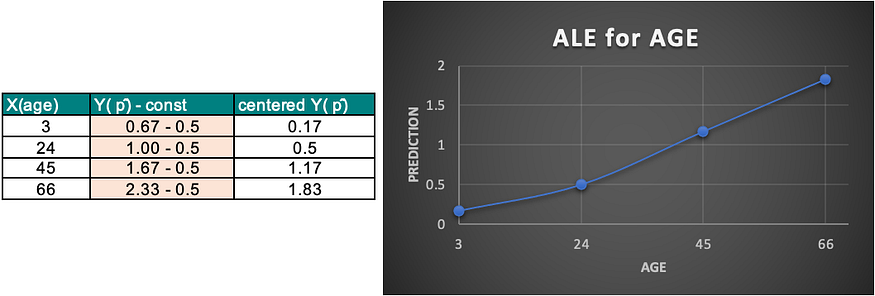
In the above example, we can see that the probability of having a stroke increases as age increases. This means that older people have a higher probability of having a stroke compared to younger people. This information can be used by medical professionals to identify the risk of stroke in different age groups and develop preventive measures accordingly.
It is important to keep in mind that partial dependence does not capture the interaction between features and only gives us information about the effect of a single feature on the target variable. They may present unrealistic scenarios, such as a 3-year-old having a BMI of 30. This is a key factor of difference when we explore ALE in the next section.
It is important to note that partial dependence plots are based on the average of predictions made by the machine learning model and may not reflect the actual probability of having a stroke for each individual. The plots should be used as a tool for understanding the relationship between features and the target variable and not for making decisions about individual cases.
2.2 ALE
Accumulated Local Effects (ALE) is a novel interpretation method that was introduced by Apley in 2018. Unlike other methods, ALE focuses on the differences in predictions rather than the averages, which makes it a more effective tool for blocking the impact of correlated features.
In order to calculate the local effects, ALE divides the feature into multiple intervals and calculates the differences in predictions for each interval. This provides a more accurate representation of the effect of the feature on the model’s prediction.
Overall, ALE plots are a more efficient and unbiased alternative to partial dependence plots (PDPs), making them an excellent tool for visualizing the impact of features on model predictions. By plotting the accumulated local effects, we can gain a deeper understanding of how features influence the model and make more informed decisions.
How is Accumulated Local effect calculated?
Accumulated Local Effects (ALE) is a method of measuring the impact of a single feature on a target variable in a machine learning model. The ALE for a feature provides a visual representation of how the feature affects the target variable across different values of the feature. Christoph Molnar’s book “Interpretable Machine Learning” provides a comprehensive explanation of the ALE method.
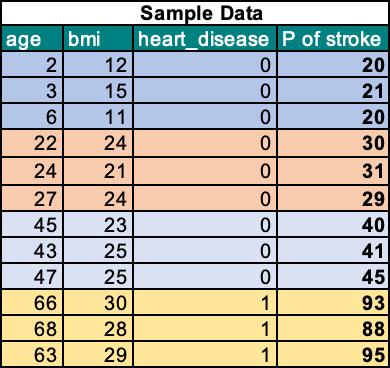
Let’s calculate the ALE for the feature ‘age’ and its impact on the target variable ‘stroke’ using a similar example in the previous section. To simplify the calculation, I’ve added a few more observations.
Here are the steps involved:
- Select the Feature of Interest: In our case, it is ‘age’.
- Define Interval/Neighbor Regions: Divide the age feature into intervals; for example, for age 3, the interval could be all ages between 2 and 6.
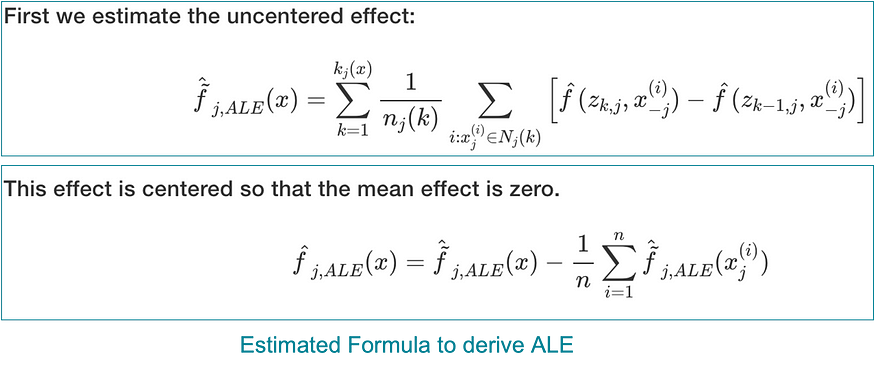
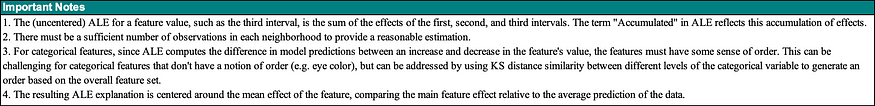
- Calculate ALE per Interval: For each interval, a) Replace the feature with the lower limit value and calculate predictions. b) Replace the feature with the upper limit value and calculate predictions. c) Average the difference in predictions between (a) and (b). d) Accumulate the effects across all intervals so that the effect of interval X3 is the accumulated effect of X1, X2, and X3.
- Center the ALE: Finally, center the accumulated feature effects at each interval so that the mean effect is zero.
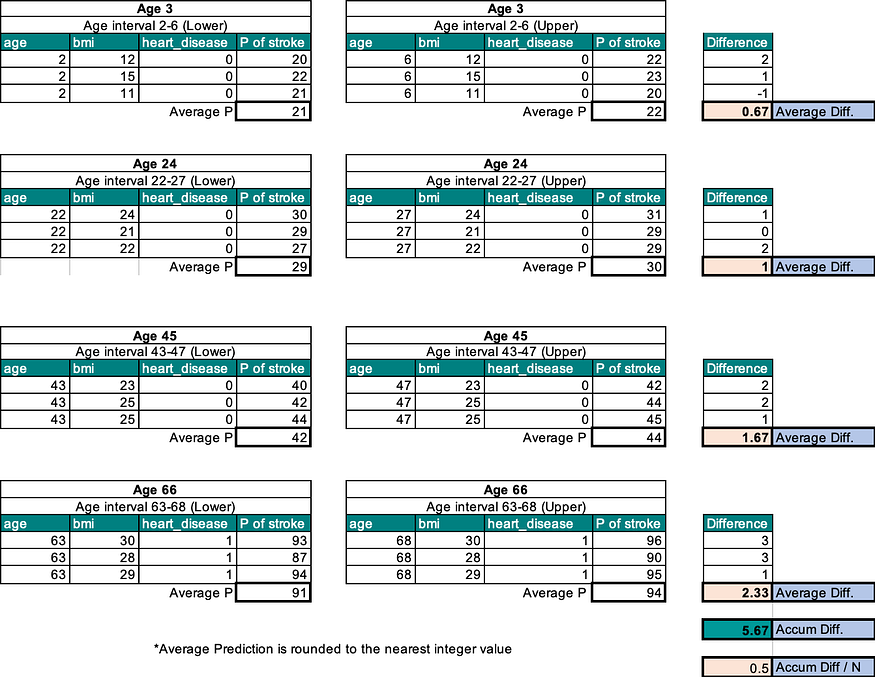
5. Plot the ALE Curve: Plot the accumulated local effects to visualize the impact of the feature ‘age’ on the target variable ‘stroke’.
2.3 Summary Comparison
The Shapash package is used to create PD plots, and the Dalex package to generate ALE plots, as demonstrated below.
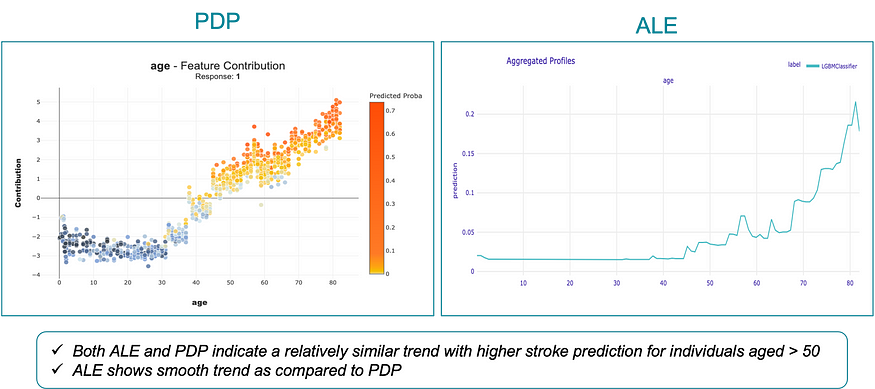
The Dalex package’s explainer object’s model_profile() function offers the capability to generate both PD and ALE plots through the use of the “type” argument, which defines the type of model profiles. The results of the computation are stored as a data frame in the “result” field, which is utilized to generate side-by-side PD and ALE plots, facilitating an in-depth comparison.
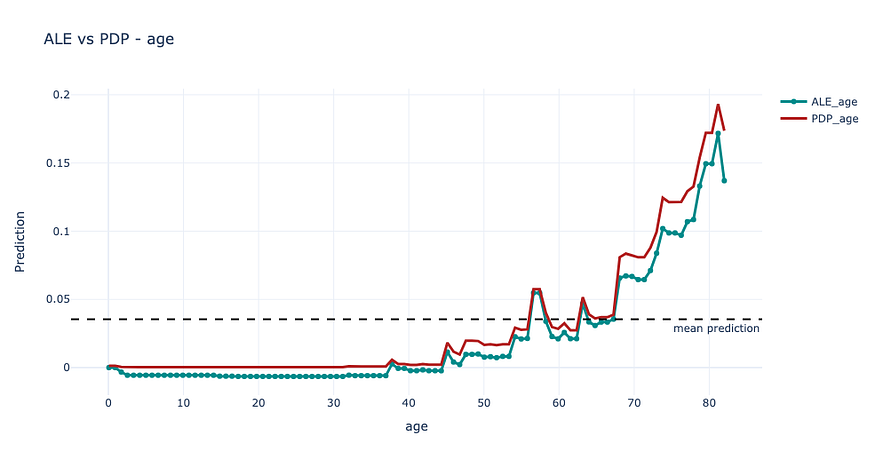
The following is a brief comparison based on the study conducted.

Method: https://christophm.github.io/interpretable-ml-book/ale.html
3. SHAP Waterfall vs. Breakdown Interaction Plots
This section begins with a general overview of SHAP and Breakdown, followed by a comparison of SHAP waterfall plots and Breakdown interaction plots based on case studies conducted on two datasets.
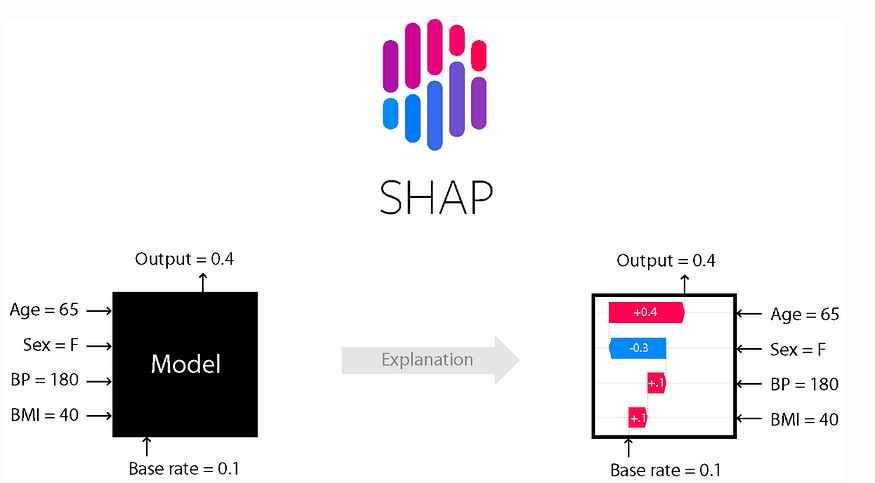
3.1 SHAP
SHAP, or SHapley Additive exPlanations, is a powerful method for understanding the decisions made by predictive algorithms. Developed in 2017 by Lundberg and Lee, SHAP is considered to be state-of-the-art in machine learning explainability.
There are three main classes of explainers in SHAP: TreeExplainer, DeepExplainer, and KernelExplainer. The TreeExplainer is model-specific and works best with decision tree-based models, while the DeepExplainer is also model-specific and is designed for deep neural networks. The KernelExplainer, on the other hand, is model-agnostic and can be used with any model.
The idea behind SHAP is based on Shapley values, a solution concept in cooperative game theory. A Shapley value is the average expected marginal contribution of one player after all possible combinations have been considered. This helps to determine a payoff for all of the players when each player might have contributed more or less than the others.
In the context of machine learning, the game refers to reproducing the outcome of the model, and the players are the features included in the model. What Shapley does is quantify each feature’s contribution to the game, or in other words, it quantifies the contribution that each feature makes to the model’s prediction. It is important to note that the game in this context only refers to one observation.
In summary, SHAP is a powerful tool for understanding the decisions made by predictive algorithms by quantifying the contribution of each feature to the prediction. Its ability to work with any model makes it a versatile option for explainability in machine learning.
How are Shapley values calculated?
For a thorough understanding of Shapely values calculation, a nice article on the topic is highly recommended. Additionally, a YouTube video that explains the concept is also available. To give a brief overview, the following steps are typically followed in the calculation of Shapely values.
- Create the set of all possible feature combinations (called coalitions)
- Calculate the average model prediction
- For each coalition, calculate the difference between the model’s prediction without F and the average prediction.
- For each coalition, calculate the difference between the model’s prediction with F and the average prediction.
- For each coalition, calculate how much F changed the model’s prediction from the average (i.e., step 4 — step 3) — this is the marginal contribution of F
- Shapley value = the average of all the values calculated in step 5 (i.e., the average of F’s marginal contributions)
Example from the Dataset
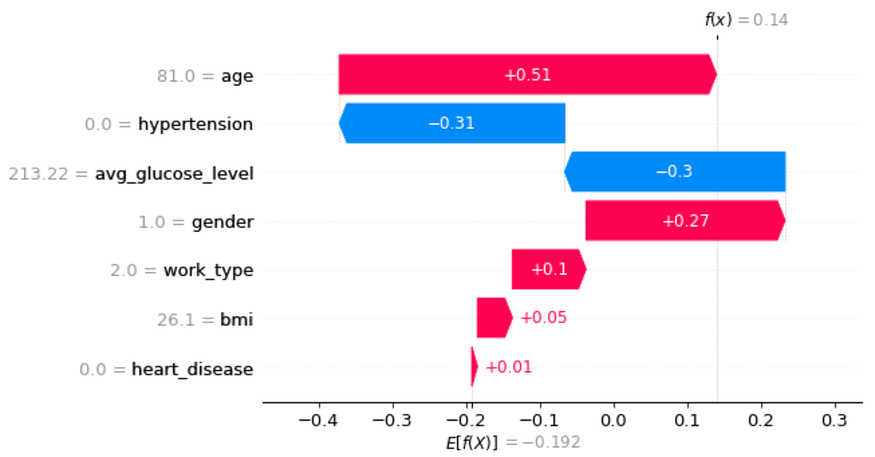
SHAP Waterfall plots show how predictions are made based on variable values. The plot starts at the bottom and shows additions or subtractions of values to reach the final prediction. In the above example, a True Positive case( an individual correctly identified as having a stroke) in the X_test dataset is used to demonstrate how the plot works. The base value is -0.192, the average of all observations, and the final prediction of 0.14 is reached through additions or subtractions of values.
3.2 Breakdown
Break Down is a model-agnostic and instance-specific method for identifying and removing features in a machine-learning model. It was first published in 2018 by Mateusz Staniak and Przemysław Biecek. The method uses a greedy strategy to iteratively identify and remove features based on their influence on the overall average predicted response.
The method starts with the mean expected model response and then successively adds variables in a sequence of their increasing contributions. Consecutive rows present changes in the mean prediction induced by fixing the value of a particular explanatory variable. This means that the order in which the variables are added can influence the contribution values.
Break Down also includes a feature called “Break Down Interaction”, which is based on the notion of interaction (deviation from additivity). This means that the effect of an explanatory variable depends on the value(s) of another variable(s).
In terms of explainability, Break Down is useful for answering the question, “Which variables contribute the most to a single observation result?” By identifying and removing features based on their influence on the overall average predicted response, Break Down can help to understand which variables are most important in making a prediction for a specific instance.
How is it calculated?
When it comes to an understanding the contributions of individual variables toward a prediction, breakdown plots are a valuable tool. These plots show how the contributions attributed to individual variables change the mean model’s prediction for a specific instance. Deriving breakdown plots is a simple process that can be done in a few easy steps.
- The starting point is the mean prediction of the model.
- Next, fix one explanatory variable (X1) at the value of the current instance, calculate all predictions, and take the mean.
- Fix X1 and X2 at their respective values and calculate all predictions, taking the mean once again.
- Repeat this process for all features.
- The last row represents the model’s prediction for the current instance.
By following these steps, you can create a breakdown plot that provides a clear picture of how each variable contributes to the final prediction. This can be especially useful when trying to understand the impact of specific variables or when dealing with complex models.
Example from the Dataset
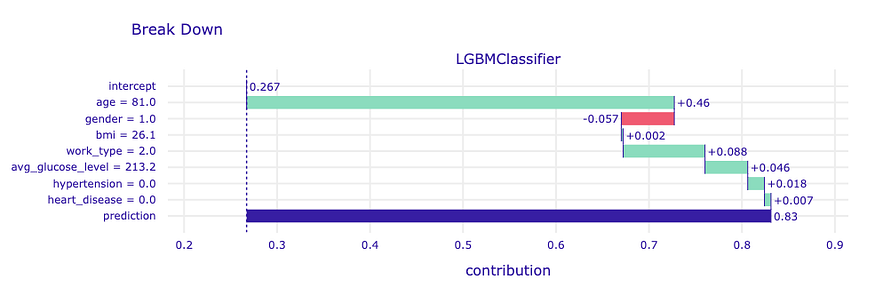
The model’s mean prediction for the stroke prediction dataset is 26.7%. This value represents the average predicted probability of stroke over all individuals in the dataset. It is important to note that this is not the percentage of individuals who actually had a stroke but rather the average model prediction. For a specific individual, the model’s prediction is 83%, which is much higher than the mean prediction. The explanatory variable that has the largest impact on this prediction is age. By holding the value of this variable constant, the mean prediction is increased by 46 percentage points. The effect of all other explanatory variables is smaller in comparison.
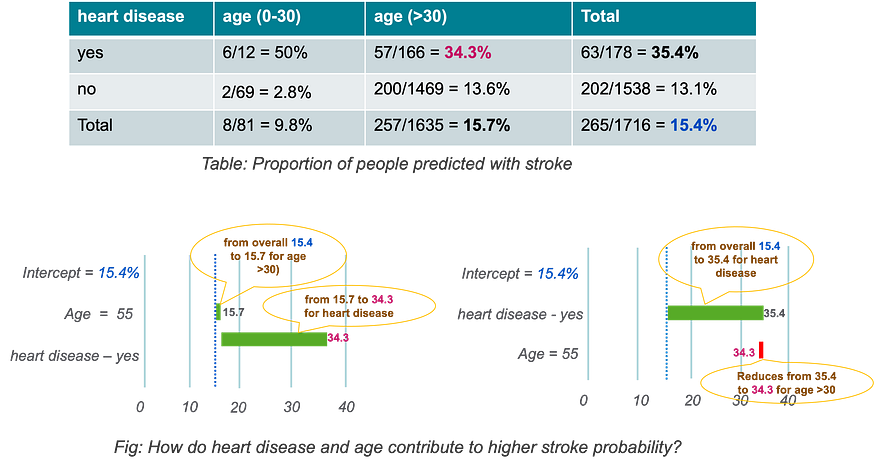
Break-down Plots for Interactions
The image below provides a clear understanding of the interaction plot. The table displays the stroke prediction results for individuals in the hypothetical stroke prediction dataset, divided by their heart disease status and age. The general proportion of stroke cases is 15.4%, but it increases to 34.3% for individuals over 30 years old who have a history of heart disease. The figure demonstrates the impact of considering heart disease and age in a specific order, revealing an interaction. The presence of heart disease has a negative effect, elevating the stroke probability from 15.4% to 35.4%. This highlights the complexity of evaluating the role of explanatory variables in model predictions when interactions are present.
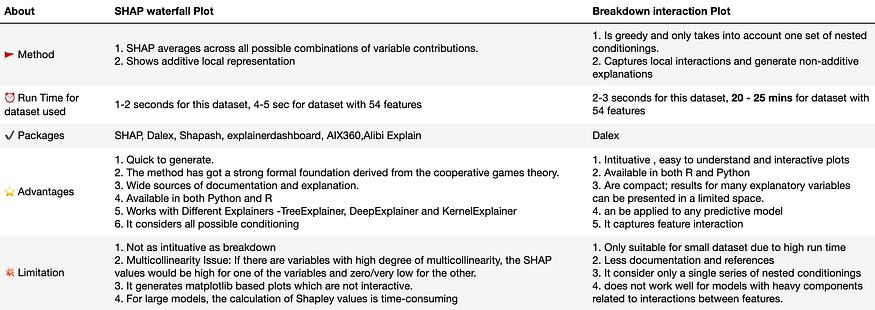
3.3 Summary comparison
The following is a brief comparison based on the study.
4. Conclusion
Both PDP and ALE have their strengths and limitations. ALE appears to have an advantage over PDP in addressing biases, but both have similar runtime. Given ALE’s advantages over PDP, it may be worth exploring further. When comparing the SHAP waterfall plot and the Breakdown plot, SHAP is faster in terms of computation time, while the Breakdown plot is more intuitive and easier to understand. Both methods have limitations, and the specific use case and requirements should be considered before choosing one over the other. When considering the choice between SHAP and Breakdown plot, it is important to consider the additive or non-additive nature of the model is explained. Currently, Breakdown may be more suitable for smaller datasets with less sparsity and size due to its heavy computational runtime.
I extend my heartfelt thanks to my colleague Prateek for his guidance throughout the project. The experience of working with XAI techniques was enriching, and there is excitement about continuing to explore this field in the future. The advancements in this field and the growing contributions from the open-source community are a testament to the increasing importance of understanding AI models, especially as they become more prevalent and impactful in our daily lives.
References
- https://christophm.github.io/interpretable-ml-book/
- https://www.darpa.mil/program/explainable-artificial-intelligence
- https://www.forbes.com/sites/cognitiveworld/2019/07/23/understanding-explainable-ai/?sh=3c062d987c9e
- https://towardsdatascience.com/shap-explain-any-machine-learning-model-in-python-24207127cad7
- https://www.youtube.com/watch?v=u7Om2joZWYs
- https://towardsdatascience.com/shap-explained-the-way-i-wish-someone-explained-it-to-me-ab81cc69ef30
- https://www.sciencedirect.com/science/article/pii/S0740624X21001027
- https://christophm.github.io/interpretable-ml-book/ale.html
- https://towardsdatascience.com/explainable-ai-xai-methods-part-3-accumulated-local-effects-ale-cf6ba3387fde
- https://docs.oracle.com/en-us/iaas/tools/ads-sdk/latest/user_guide/mlx/accumulated_local_effects.html
- https://towardsdatascience.com/partial-dependence-plots-with-scikit-learn-966ace4864fc
- https://towardsdatascience.com/explainable-ai-xai-methods-part-1-partial-dependence-plot-pdp-349441901a3d
- https://shap.readthedocs.io/en/latest/index.html
- https://ema.drwhy.ai/breakDown.html
- https://medium.com/responsibleml/basic-xai-with-dalex-part-4-break-down-method-2cd4de43abdd
- https://uc-r.github.io/dalex
- https://arxiv.org/abs/1903.11420
Join thousands of data leaders on the AI newsletter. Join over 80,000 subscribers and keep up to date with the latest developments in AI. From research to projects and ideas. If you are building an AI startup, an AI-related product, or a service, we invite you to consider becoming a sponsor.
Published via Towards AI
Towards AI Academy
We Build Enterprise-Grade AI. We'll Teach You to Master It Too.
15 engineers. 100,000+ students. Towards AI Academy teaches what actually survives production.
Start free — no commitment:
→ 6-Day Agentic AI Engineering Email Guide — one practical lesson per day
→ Agents Architecture Cheatsheet — 3 years of architecture decisions in 6 pages
Our courses:
→ AI Engineering Certification — 90+ lessons from project selection to deployed product. The most comprehensive practical LLM course out there.
→ Agent Engineering Course — Hands on with production agent architectures, memory, routing, and eval frameworks — built from real enterprise engagements.
→ AI for Work — Understand, evaluate, and apply AI for complex work tasks.
Note: Article content contains the views of the contributing authors and not Towards AI.
Related posts
Recent Posts


")

