Understanding the Emotion Tone of Text with AI — Sentiment Analysis on Monkeypox Tweets
Last Updated on July 26, 2023 by Editorial Team
Author(s): Kirsten Jiayi Pan
Originally published on Towards AI.
Understanding the Emotion Tone of Text with AI — Sentiment Analysis on Monkeypox Tweets
How do companies and organizations understand customers’ feelings or public’s sentiment regarding a trending event? The most common approaches would be reading hundreds of reviews and comments online, setting up feedback interviews, or asking the public to fill out surveys. Let’s say we have collected this valuable data from the public, what should we do next to extract value out of it?
Before revealing the mystery, we will make an example study using the Monkeypox virus topic, one of the latest spreading infectious diseases, and see how the public feels about it. After having collected around 13.5k tweets for the past 12 months from Twitter as our sample corpus, we will conduct a sentiment analysis of how the public feels about the Monkeypox virus.
What is a Sentiment Analysis, and Why is it Important?
Sentiment analysis has been widely used since the early 20th century, and its research area is still fast growing. One of the most advanced solutions is to use AI to proceed with sentiment analysis. The algorithm uses a natural language processing (NLP) technique which enables it to determine the moods or emotions of a piece of text. In this case, companies can react based on user feedback.
When we are using this algorithm to analyze a corpus, a sentiment score will be assigned to it. A sentiment score is an indicator between -1 to 1, which shows if the content in the corpus is expressing positive (1), neutral (0), or negative sentiment (-1).
- Sentiment scores in the range of between 0.2 and 1, and the text tends to be increasingly leaning toward a positive mood.
- Sentiment scores in the range of between -0.2 and -1, the text would tend to be considered as negative or very negative.
- Sentiment score in the range of between -0.2 and 0.2, the text is considered neutral.
Companies that extract customer sentiment scores can use it as one of their KPIs since it can indicate how their customers feel about their brand.
On Hand!
Web Scraping
Disclaimer: This article is only for educational purposes. We do not encourage anyone to scrape websites, especially those web properties that may have terms and conditions against such actions.
As mentioned previously, we are going to scrape around 13.5k tweets for the past 12 months from Twitter about the Monkeypox virus. The main Python library that we use at this step is called snscrape.


As you can see, we have successfully collected 13540 tweets as our sample corpus, which are temporarily saved in a DataFrame. There are 4 columns in this DataFrame: ‘Datetime’, ‘Tweet ID’, ‘Text’, and ‘Username’.
Calculating Sentiment Score and Data Cleaning
After having prepared our data, we can now use a library called TextBlob to calculate the sentiment score for each tweet.


Each tweet is assigned with a sentiment score which shows in a new column called ‘sentiment’. Before further analysis, we found out that there are many tweets that are neutral (sentiment score between -0.2 and 0.2). Neutral means that there are no opinion impacts or unrelated comments. In this case, we only want to focus on tweets that show positive and negative emotions by hiding tweets that are neutral.
Visualization
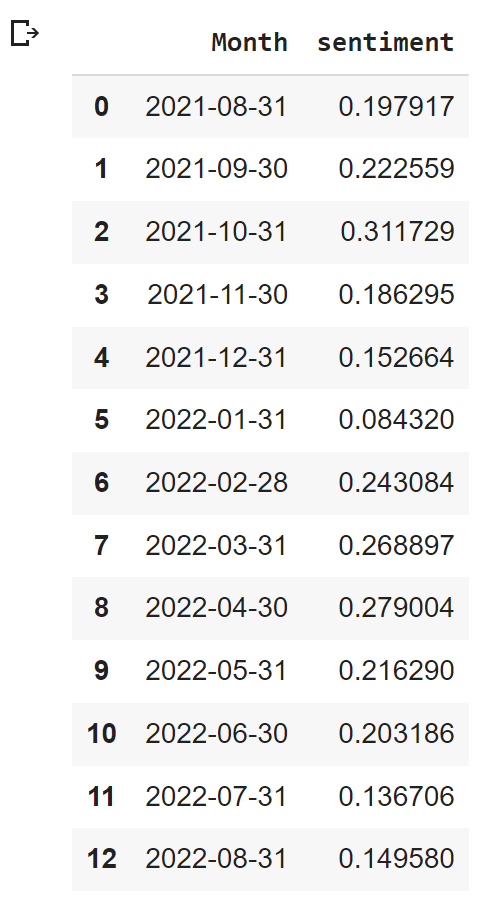
Next, we are going to calculate and visualize the average sentiment score that is grouped by month to see the trend of how the public feels about the Monkeypox virus from time to time. The Python library for visualizing monthly average sentiment score is plotly.express.

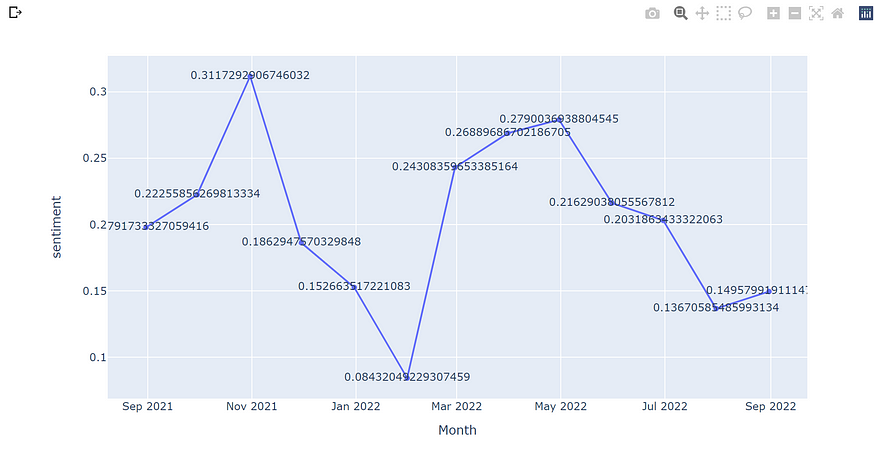
These are the mean sentiment scores for each month. Next, we are going to visualize a line graph by using the data above.

The line graph above illustrates sentiment scores from late August 2021 to late August 2022. The two most sharp declines happened between Nov 2021 to February 2022 and May 2022 to August 2022. The two lowest spots on this plot graph are February 2021 and August 2022, which could be due to major announcements from the government public health departments. Overall, the public has had negative emotions toward the Monkeypox virus for the past 12 months.
Eventually, we are using WordCloud to picture the keywords that are being mentioned the most in our corpus based on counting the frequency. The larger the words appear on the word cloud, the more often it was mentioned by the public.

Conclusion
As you can see, using AI to implement sentiment analysis is very productive for companies and organizations that need to review feedback from their customers or the public, especially when the dataset is large. By using this algorithm, we can easily keep track of the public emotions regarding this latest spreading infectious disease. This will be very helpful for related departments to decide what actions to take that can eliminate the anxiety from the public in the future.
Join thousands of data leaders on the AI newsletter. Join over 80,000 subscribers and keep up to date with the latest developments in AI. From research to projects and ideas. If you are building an AI startup, an AI-related product, or a service, we invite you to consider becoming a sponsor.
Published via Towards AI
Take our 90+ lesson From Beginner to Advanced LLM Developer Certification: From choosing a project to deploying a working product this is the most comprehensive and practical LLM course out there!
Towards AI has published Building LLMs for Production—our 470+ page guide to mastering LLMs with practical projects and expert insights!

Discover Your Dream AI Career at Towards AI Jobs
Towards AI has built a jobs board tailored specifically to Machine Learning and Data Science Jobs and Skills. Our software searches for live AI jobs each hour, labels and categorises them and makes them easily searchable. Explore over 40,000 live jobs today with Towards AI Jobs!
Note: Content contains the views of the contributing authors and not Towards AI.


