


Statistics 101-Part 1-What is Hypothesis testing ?
Last Updated on September 7, 2022 by Editorial Team
Author(s): Kumar kaushal
Originally published on Towards AI the World’s Leading AI and Technology News and Media Company. If you are building an AI-related product or service, we invite you to consider becoming an AI sponsor. At Towards AI, we help scale AI and technology startups. Let us help you unleash your technology to the masses.
Statistics 101-Part 1-What Is Hypothesis Testing, Its Type, and Its Process?
Definition of hypothesis testing, the process of doing hypothesis testing, its types, and applications
This is a part of a series of articles related to Statistics 101. In Statistics, business analytics, and any other domain, we must have come across the term hypothesis testing. This article aims to provide a step-by-step guide for conducting hypothesis testing. We would understand the meaning of the term, its keywords, types, and applications. We would also elaborate on the meanings of important keywords such as p-value, significance value, and others.
Contents
- Definition and importance
- Hypothesis testing Process
- Applications
- References
Let’s begin!!!
Imagine a scenario where a manager of an electric vehicle company claims that the latest model runs 300 miles on a single charge. How would someone test or validate this assumption?
Hypothesis Testing would come to our rescue in such situations.
Definition and importance
If we refer to any dictionary for the meaning of a Hypothesis, it will point to the word “assumption”. For example, Merriam-Webster defines a Hypothesis as:
“a tentative assumption made in order to draw out and test its logical or empirical consequences”
Hence, hypothesis testing is the process of stating some assumption, testing it, and making some inference about the population basis the assumption made.
For the electric vehicle example stated at the beginning of this article, we could test the hypothesis on a sample and evaluate the results to make inferences regarding the average running of such vehicles, i.e., whether it is equal to 300 miles per charge or not. In the absence of Hypothesis Testing, it would be challenging to make inferences on the population parameters.
Hypothesis Testing Process
Step 1- Decide if the hypothesis is two-tailed or one-tailed
Step 2- Formulate the null hypothesis and the alternate hypothesis and set the significance level
Step 3- Basis the distribution to be considered, p-value to be calculated
Step 4- Compare the p-value with the significance level and select a null or alternate hypothesis to infer
Let’s go through each step in detail.
Step 1- Decide if the hypothesis is a two-tailed or one-tailed
Check the below statement:
Statement 1-Life expectancy in Asian countries is 60 years.
Here, this is a case of a two-tailed test where the hypothesized population parameter is compared for equality(=)or non-equality(!=) to a certain value.
Statement 2-Life expectancy in Asian countries is more than 60 years.
Statement 3-Average length of a video on YouTube a user watches is less than 7 minutes.
The above scenarios are cases of one-tailed hypothesis testing where the hypothesized population parameter is stated to be more or less than a certain value.
Step 2- Formulate hypothesis- null and alternate Hypothesis and set the significance level.
A null hypothesis(H0) is a hypothesis that is assumed as true until there is statistical evidence to “not accept it”. When the null hypothesis is not accepted, the alternate hypothesis (H1) is accepted.
For statement 1, the hypotheses statements would be:

And, for statement 3, it would be:

If we say that the Significance level is 0.05, it means the difference between the sample statistic(say mean- which has been calculated for the sample) and the hypothesized mean (60 for statement 1) has a 5% chance of occurring.
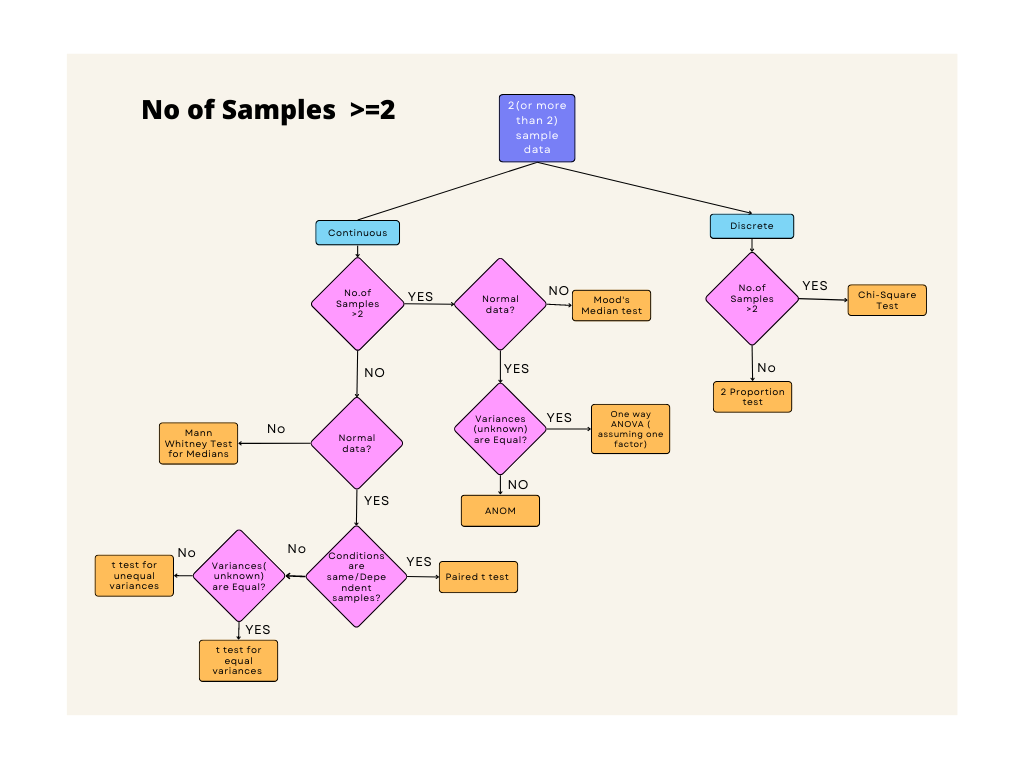
Step 3- Basis the distribution to be considered, p-value to be calculated
The below flow may be referred to for choosing the distribution to be used for the sample data.
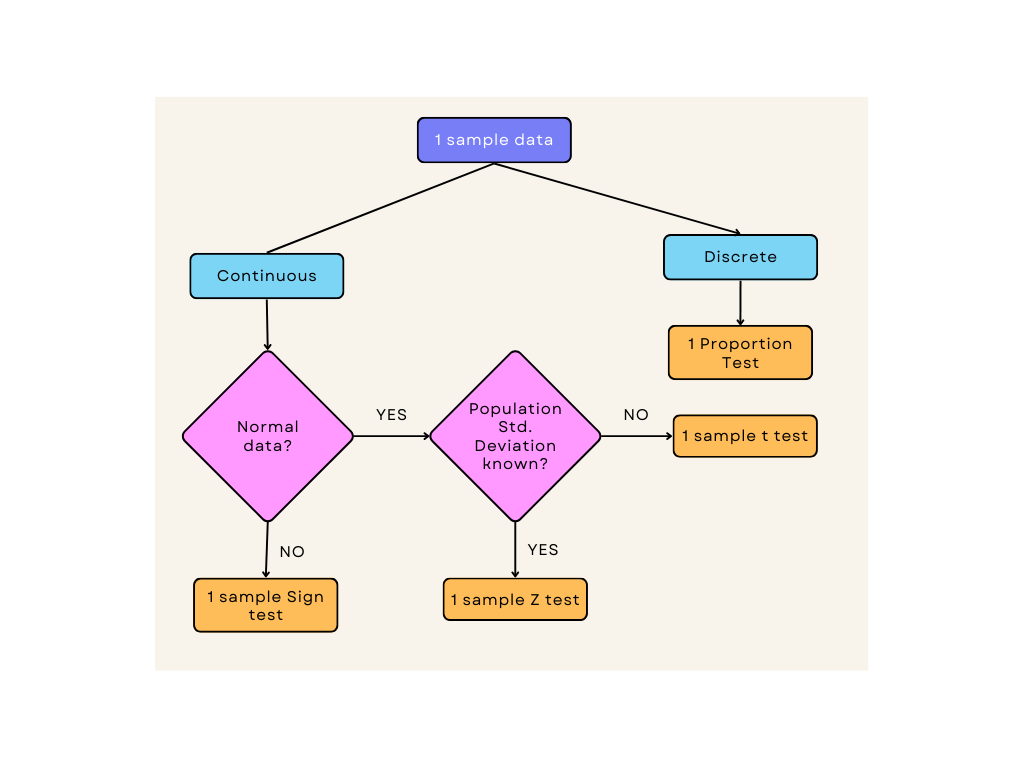
p-value (probability value), the probability of the null hypothesis is true. It is also called the calculated probability of committing a Type-1 error.
Step 4- Compare the p-value with the significance level and select the null or alternate Hypothesis to infer
Suppose the p-value is less than or equal to the significance level; hence, the probability of the null hypothesis being true is not significant. So, we reject the null hypothesis. If the p-value is greater than the significance level, we reject the alternate hypothesis.
A good reference to understand this is the Minitab blog.
Applications
Hypothesis Testing applies to scenarios where we are making or proposing any assumption and testing those. Be it manufacturing, clinical trials, marketing strategies, and any other domain, it is only left to the imagination of a business manager to apply Hypothesis Testing to these applications.
References
- Definition of HYPOTHESIS
- Statistical population – Wikipedia
- Type I and type II errors – Wikipedia
- Understanding Hypothesis Tests: Significance Levels (Alpha) and P values in Statistics
Statistics 101-Part 1-What is Hypothesis testing ? was originally published in Towards AI on Medium, where people are continuing the conversation by highlighting and responding to this story.
Join thousands of data leaders on the AI newsletter. It’s free, we don’t spam, and we never share your email address. Keep up to date with the latest work in AI. From research to projects and ideas. If you are building an AI startup, an AI-related product, or a service, we invite you to consider becoming a sponsor.
Published via Towards AI
Towards AI Academy
We Build Enterprise-Grade AI. We'll Teach You to Master It Too.
15 engineers. 100,000+ students. Towards AI Academy teaches what actually survives production.
Start free — no commitment:
→ 6-Day Agentic AI Engineering Email Guide — one practical lesson per day
→ Agents Architecture Cheatsheet — 3 years of architecture decisions in 6 pages
Our courses:
→ AI Engineering Certification — 90+ lessons from project selection to deployed product. The most comprehensive practical LLM course out there.
→ Agent Engineering Course — Hands on with production agent architectures, memory, routing, and eval frameworks — built from real enterprise engagements.
→ AI for Work — Understand, evaluate, and apply AI for complex work tasks.
Note: Article content contains the views of the contributing authors and not Towards AI.
Related posts
Recent Posts


")

