


Multi-Objective Optimization Model Solved using R — Part2
Last Updated on August 14, 2021 by Editorial Team
Author(s): Supriya Ghosh
Optimization
Multi-Objective Optimization Model Solved using R — Part2
Isn’t it great to solve the Multi-Objective optimization problem of Goal Programming using “R”?
If yes, then here is something which you can vouch for.
In this write-up, I am going to deep dive into how can we solve the Multi-Objective Optimization Problem when we have the model already developed at hand?
I will make use of the ‘R’ language to find the optimal solutions given the developed model, its objectives, constraints, and deviational variables. I will further elaborate on the solution to make you understand every aspect of it.
In Part 1,
Multi-Objective Optimization Model development using Goal Programming
I have already elaborated on the complete model formulation process from scratch.
Let me start with re-iterating the Manufacturing Case used earlier based on which the Optimization Model was developed.
One of the popular lighting companies produces two products range, colorful lampshades and LED lights. Both the product requires a 2 — step production process involving wiring and assembly. It takes about 2 hours to wire each lampshade and 3 hours to wire each LED light. The final assembly of the lampshade and LED light requires 6 and 5 hours respectively. The production capability is such that only 12 hours of wiring time and 30 hours of assembly time are available. The company is stringent on utilizing wiring department hours to the maximum without any wastage and also looking forward to no overtime in the assembly department. It earns a profit of $7 from each lampshade and $6 from each LED light. Also, the company has a contractual obligation to fulfill a minimum of 7 LED lights delivery.
But in parallel, the company is moving to a new strategic location and feels that initially maximizing profit is not a realistic objective. Management sets a profit level of $30 that would be satisfactory during this period.
The company wants to find out the product mix that achieves this goal as closely as possible given the production time constraints.
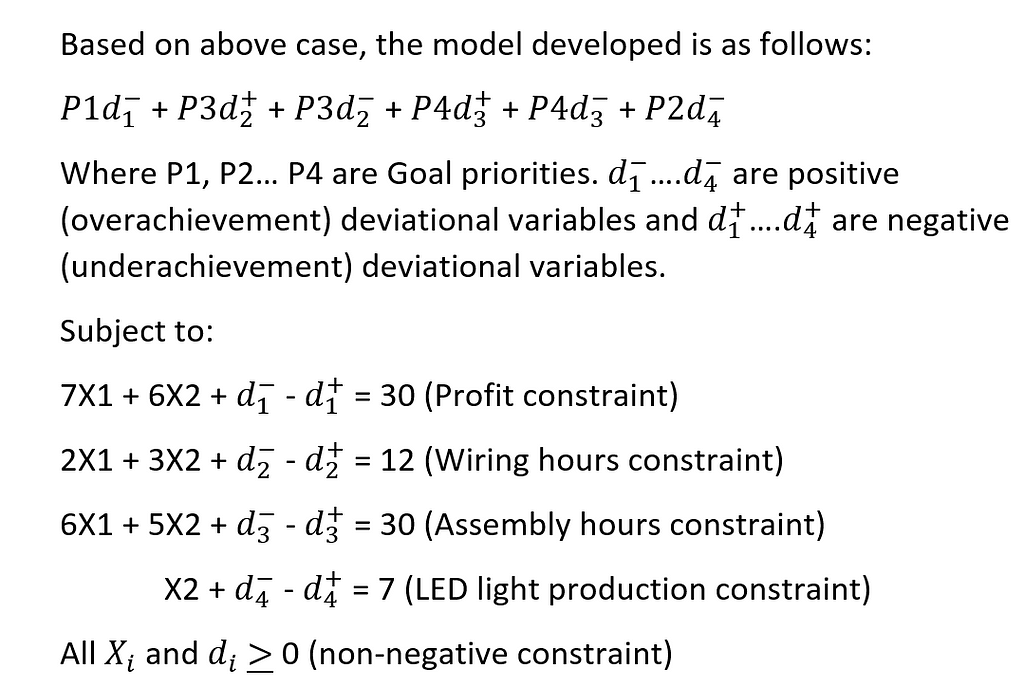
Based on the above case, the model developed is as follows:
Where X1 and X2 are decision variables.
Now. let’s solve this to get our optimal solution.
Step 1 — Construct a coefficient matrix.
In this case, our coefficients will be derived from the numeric values associated with X1 and X2 variables.
i.e., 7X1 + 6X2, 2X1 + 3X2, 6X1 + 5X2 and X2.
This gives us the 4 x 2 matrix as

Here The number of rows equals the number of objectives, and the number of columns equals the number of decision variables.
Step 2 — Construct a Target vector
The target vector is the target values set to be achieved for the objectives.
Here the number of elements is equal to the number of objectives.
Step 3 — Construct the Achievement Data Frame which defines the achievement goals.
This data frame has 1st column set as objective and it contains the index for a particular objective.

Since we have 4 objectives hence count of 1,2…4 is mentioned.
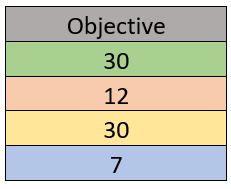
2nd column is the Priority, and it captures the priority of the assigned objective.
Since 1st objective is of top priority followed by 4th objective then 2nd and 3rd respectively, hence the below depiction of the same.
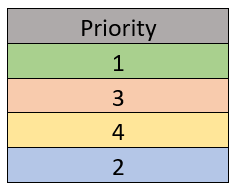
3rd column is the representation of positive deviational variables,(Overachievement).
Generally, it is depicted by notation “p” in the “R” Visuals.
4th column is the representation of negative deviational variables,(Underachievement).
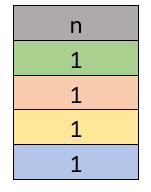
Generally, it is depicted by notation “n” in the “R” Visuals.
Step 4 — Final computation of optimal result making use of R package and function subjected to minimization of deviational variables.
Here “R” uses a modified simplex method to derive an optimal solution.
One more important point to consider over here is that if apart from priority even weight needs to be considered for goals, then the data frame will have five named columns. The first four columns are identical to the columns already mentioned above. The fifth column is called ‘w’ and it is the weight associated with the specified priority level.
Below is the complete R — Code captured to show computation.
# Copy "goalprog" package from the specified path
url <- "https://cran.r-project.org/src/contrib/Archive/goalprog/goalprog_1.0-2.tar.gz"
pkgFile <- "goalprog_1.0-2.tar.gz"
download.file(url = url, destfile = pkgFile)
# Install "goalprog" package
install.packages(pkgs=pkgFile, type="source", repos=NULL)
library(goalprog)
# Use function llgp() to solve multi-opjective optimization model
# List coefficients as specified in objective functions
# Store as a matrix
coefficients <- matrix( c( 7, 6, 2, 3, 6, 5, 0, 1 ), nrow=4, byrow=TRUE )
coefficients
# List target values as specified in objective functions
# Store as a vector
targets <- c( 30, 12, 30, 7 )
targets
# List achievement goals as specified in objective functions
# Store as a data frame, where 1st column is objective,2nd column is priority,
# 3rd column is deviational variable indicating overachievement and is indicated as p,
# 4th column is deviational variable indicating underachievement and is indicated as n,
achievements <- data.frame( matrix(
  c( 1, 1, 0, 1,
     2, 3, 1, 1,
     3, 4, 1, 1,
     4, 2, 0, 1), nrow=4, byrow=TRUE ) )
# Functions to get or set the names of an object.
names( achievements ) <- c( "objective", "priority", "p", "n" )
achievements
soln <- llgp( coefficients, targets, achievements )
soln$out
print( soln$out)
A glimpse of captured results from executing “R” code which I will explain in detail to derive a conclusion.
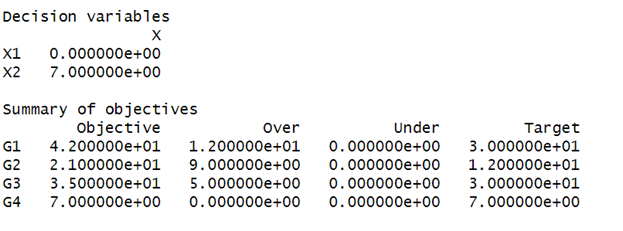
The above result denotes
X1 as 0 (no Lampshades produced during the period)
X2 as 7 (7 LED lights produced as per contractual obligation)
d1+ = 12 (Profit overachieved by $12 as target was $30 but achieved is $42).
d2+ = 9 (9 hours of Overutilization in the Wiring department as the target was 12 hours but achieved is 21 hours)
d3+ = 5 (5 hours of Overtime in the Assembly department as the target was 30 hours but achieved is 35 hours)
Note — As per optimal result, there is no need for underachievement deviational variables value to be optimized in this case hence “under” column has everything as 0. Depending on the problem at hand, the optimal solution can include underachievement deviational variables as well.

Hence with this result, we conclude that our high priority goals of target profit and no contractual breach has been well-taken care of at the expense of lower priority goals as goal programming works on the “Satisficing” principle rather than complete minimization or maximization principle. In this case, the achieved solution is the most optimal one, given the Goals Priority and constraints.
Hope you liked this.
You can follow me on LinkedIn: Supriya Ghosh
And Twitter: @isupriyaghosh
Multi-Objective Optimization Model Solved using R — Part2 was originally published in Towards AI on Medium, where people are continuing the conversation by highlighting and responding to this story.
Published via Towards AI
Towards AI Academy
We Build Enterprise-Grade AI. We'll Teach You to Master It Too.
15 engineers. 100,000+ students. Towards AI Academy teaches what actually survives production.
Start free — no commitment:
→ 6-Day Agentic AI Engineering Email Guide — one practical lesson per day
→ Agents Architecture Cheatsheet — 3 years of architecture decisions in 6 pages
Our courses:
→ AI Engineering Certification — 90+ lessons from project selection to deployed product. The most comprehensive practical LLM course out there.
→ Agent Engineering Course — Hands on with production agent architectures, memory, routing, and eval frameworks — built from real enterprise engagements.
→ AI for Work — Understand, evaluate, and apply AI for complex work tasks.
Note: Article content contains the views of the contributing authors and not Towards AI.
Related posts
Recent Posts

")


