


.")
Model Monitoring Dashboards made easy (1/3).
Last Updated on January 6, 2023 by Editorial Team
Last Updated on November 15, 2021 by Editorial Team
Author(s): Mohneesh S
Originally published on Towards AI the World’s Leading AI and Technology News and Media Company. If you are building an AI-related product or service, we invite you to consider becoming an AI sponsor. At Towards AI, we help scale AI and technology startups. Let us help you unleash your technology to the masses.
In this 3 part series, I will show how you can easily make model monitoring dashboards.
I know the pain of model monitoring and retraining models is not very pleasant for any machine learning engineer, more so if there isn’t any easy way to keep track of all the models that are deployed on production or somewhere else that needs to be monitored.
In this 3 part series, I will cover building model monitoring dashboards with interactive GUI, with minimal code for the GUI part.
Part 1: Building a simple GUI interface with a basic model monitoring interface and evaluation metrics. We will use streamlit to get the job done, which is the best thing out there among all its competitors.
Part 2: We will add more complex model monitoring metrics and here, we will use services like Evidently, to pass data to the already built GUI with basic functionality.
Part 3: We will add automation to the retraining as well here wherever possible and build CI/CD pipeline using GitHub actions, also will try out different alternatives.
Note: This guide is the most basic guide which assumes you already have data fetch pipelines setup (CSV files, databases, REST APIs).
Let’s get started.
Things to Do:
- Data Exploration (in brief)
- Model Monitoring introduction
- Streamlit basics and GUI building
Data Exploration (in brief)
The data we are going to use is from kaggle. You can find it here. This is a dataset for heart failure prediction. Let’s have a basic understanding of the data.
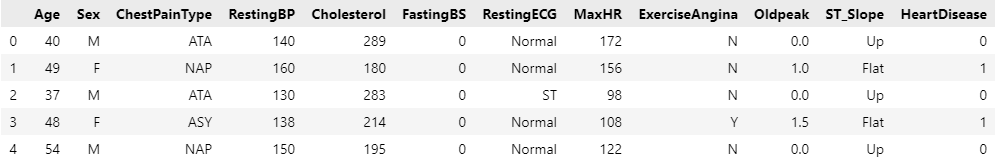
Above is a glimpse of the data, let’s check the data types and null values (if any) in the data.
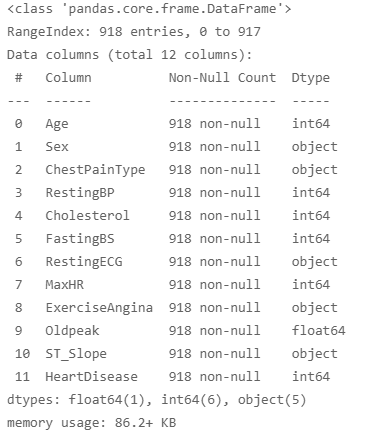
There aren’t any null values in the dataset and there are a total of 11 features that determine if there is a risk of heart disease. I will do a very basic EDA here as a complex EDA is out of the scope of this article.
We will look at the correlation to different features and the target variable HeartDisease.
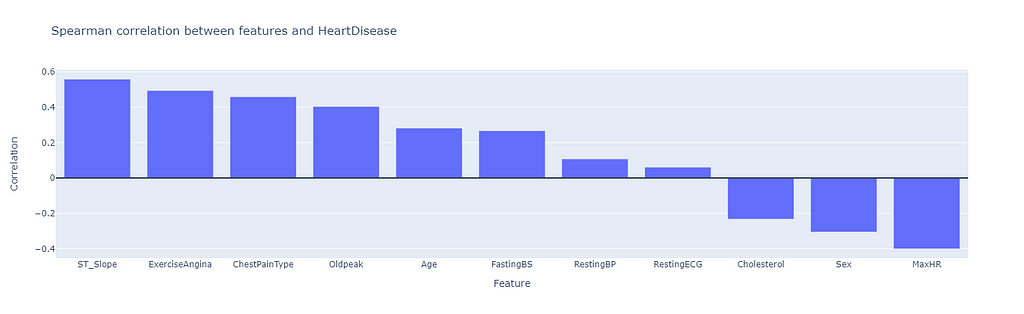
We now have an idea of how the features are correlated. For a detailed and well-illustrated EDA, take a look at this notebook.
Model monitoring Introduction
Although this is a larger concept in itself, I will try to give a brief introduction as to why do we even need model monitoring.
Let’s take an example, you wrote some code to fetch data from the database and display it over the frontend. In this case, the code written will work as expected even after a long time, given that the database itself is not tampered with. This is deterministic behavior of the code, in the case of machine learning models, the probabilistic nature of the model and the ever-changing data makes the outcome of the model very non-deterministic and the model performance degrades over time. Although this said time is not consistent and changes with each use case and is very domain and data specific, hence the need to model the model performance in real-time (or near-realtime).
This non-deterministic nature of the models can be caused due to many factors, I will try to explain some of them.
- Data distribution changes over time (maybe)
This is well… very domain-specific. There is a chance of data distribution change over time and the model that is trained over one kind of data might not be the best choice for another.
- Model Drift
Some models need to be retrained regularly to be accurate, for eg. time-series data, also many models can run without any update for more than a year, for eg. CV models and some classification scenarios. Whatever the case a model which will give a good result now will not necessarily give the best result after a set period of time, ie. the model decays over time.
- Outliers
If the pipeline doesn’t treat its outliers well, it can hurt the performance in the long run. In some cases, like the start of a business, there might be no outliers at all, but as the business grows there will be many outliers which the old model won’t be able to withhold.
There are many reasons that you might want to monitor your models in production such as interpretation of the models to the upper management or the customers, prediction latencies in the production can be different than on the local. Explaining all these will take an article in itself, So I will not be going into the details.
Streamlit basics and GUI building
Streamlit makes life easier for Data scientists and machine learning engineers out there. It’s the best among its competitors, just because it doesn’t have any hidden pricing issue (that I know of), also the community support is excellent and updates are very regular.
First things first, install streamlit using the below command in your python/conda environment. I suggest making a new one as it will be easier to ship that way.
pip install streamlit
for now you only need this package, other than the basic numpy, pandas, and matplotlib/plotly.
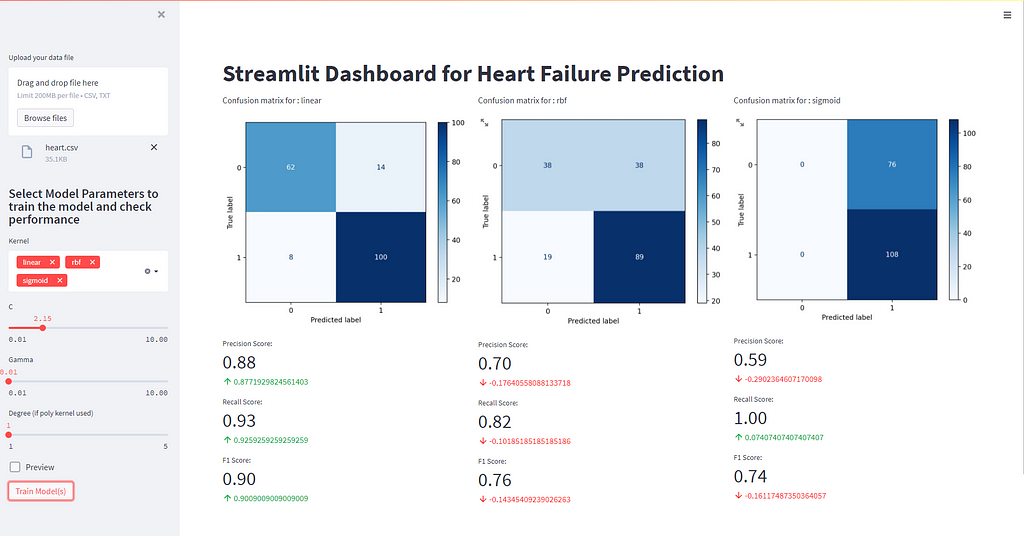
I have tried to use only SVM for now, for the simplicity of the article. You can go ahead and add as many algorithms as you need. To get the above interface, you just need to write the below code in a python file. If you want to try out the dash live you can do that Here.
Really simple is it not, for any additional buttons or selection boxes, refer to the API reference for streamlit which is very simple and intuitive.
In this part we are only going to accommodate basic monitoring controls, we will be enabling more advanced monitoring instruments and model evaluation metrics with better choices from the user as well. This was just a basic introduction to how we want to see our data in the dashboard.
This is the end of this part. I don’t want to include everything in one article which would make it cumbersome to read and follow.
Stay Tuned for the next part. Don’t forget to fiddle around with this online app.
Cheers!!
Model Monitoring Dashboards made easy (1/3). was originally published in Towards AI on Medium, where people are continuing the conversation by highlighting and responding to this story.
Join thousands of data leaders on the AI newsletter. It’s free, we don’t spam, and we never share your email address. Keep up to date with the latest work in AI. From research to projects and ideas. If you are building an AI-related product or service, we invite you to consider becoming a sponsor.
Published via Towards AI
Towards AI Academy
We Build Enterprise-Grade AI. We'll Teach You to Master It Too.
15 engineers. 100,000+ students. Towards AI Academy teaches what actually survives production.
Start free — no commitment:
→ 6-Day Agentic AI Engineering Email Guide — one practical lesson per day
→ Agents Architecture Cheatsheet — 3 years of architecture decisions in 6 pages
Our courses:
→ AI Engineering Certification — 90+ lessons from project selection to deployed product. The most comprehensive practical LLM course out there.
→ Agent Engineering Course — Hands on with production agent architectures, memory, routing, and eval frameworks — built from real enterprise engagements.
→ AI for Work — Understand, evaluate, and apply AI for complex work tasks.
Note: Article content contains the views of the contributing authors and not Towards AI.
Related posts
Recent Posts


")

