


Joining Data in Tableau: A Road to Tableau Desktop Specialist Certification
Last Updated on April 4, 2022 by Editorial Team
Author(s): Daksh Trehan
Originally published on Towards AI the World’s Leading AI and Technology News and Media Company. If you are building an AI-related product or service, we invite you to consider becoming an AI sponsor. At Towards AI, we help scale AI and technology startups. Let us help you unleash your technology to the masses.
Chapter 5: A comprehensive guide to Relationships, Joins, Unions & Blending in Tableau
Welcome to the fifth chapter, In this piece, we are going to learn about joining data in Tableau and which one should you go for.
If you want to navigate through other chapters, visit: Tableau: What it is? Why it is the best?; A road to Tableau Desktop Specialist Certification.
If you want to directly go on Tableau Desktop Specialist notes, access them here → https://dakshtrehan.notion.site/Tableau-Notes-c13fceda97b94bda940edbf6751cf30
Use the link to get access to free Tableau certification dumps (Valid till 13 Apr 2022):
When we connect our data, Tableau lets us join data in different ways, each way is unique for specific data types and use-cases.
Every time we add a data source to Tableau, we create a Data Model. As the name suggests, it specifies how Tableau should query different tables to combine the data. A Data Model can comprise a single table or multiple tables that use different combinations of Relationships, Joins, Union.
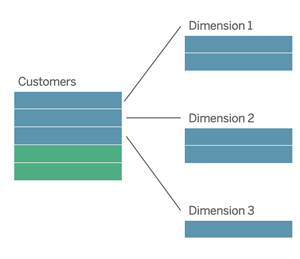
Table of Content
- Logical Layer & Physical Layer
- Relationships
- Joins
- Unions
- Data Blending
- Which one to choose?
- Sample Exam Questions from this Topic
Logical Layer & Physical Layer
Tableau Data Model comprises of two layers:
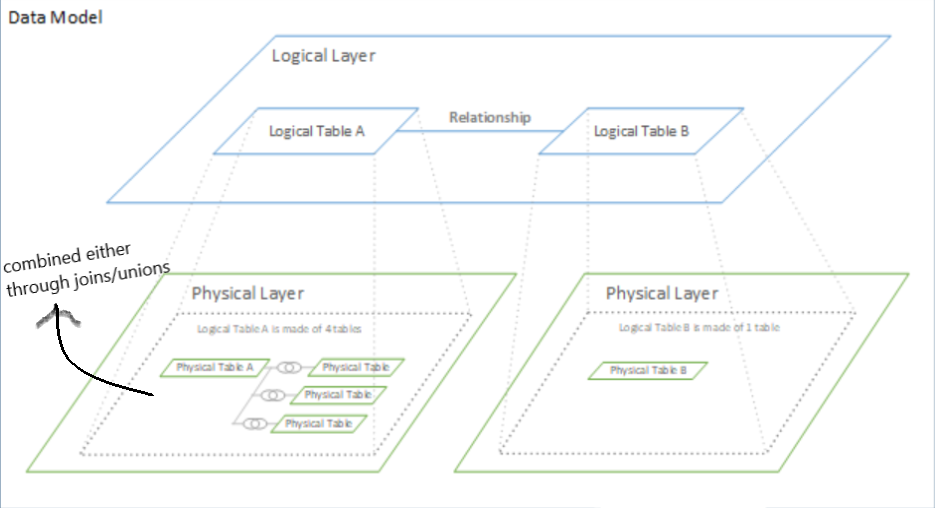
Logical Layer → The default data canvas view in our Data Source Page is our Logical Layer. It enables to join the data using Relationships(or Noodles). While combining data from multiple tables, we don’t specify joins in Logical Layer but rather perform Relationship where Tableau automatically chooses adequate join type based on data and analysis. Tables formed in Logical Layers are known as Logical Tables.
In earlier Tableau versions, there was only a Physical Layer, but from v2020.2 onwards, Tableau introduced Relationships & Logical Layer. The tables in logical layers aren’t merged, instead, they remain distinct.
The logical Layer consists of merged Physical Tables and other Logical Tables. Logical Tables may contain single or multiple physical tables associated with unions or joins.
Physical Layer → This can be regarded as a sub-logical layer, to access it, double click a logical table. It enables a combination of data using Joins/Union. Tables joined in Physical Layer are known as Physical Tables and are merged into a single flat table after transformations.
Relationships

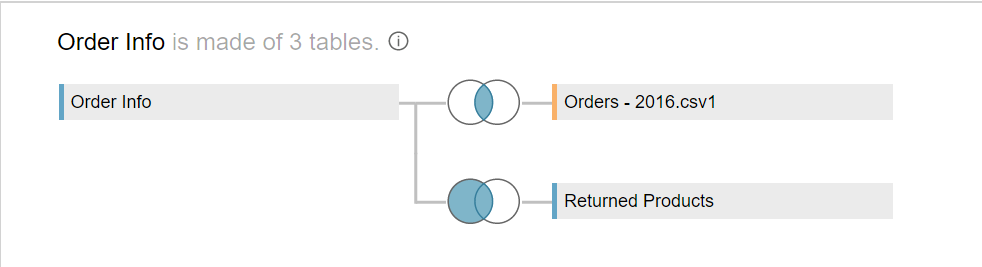
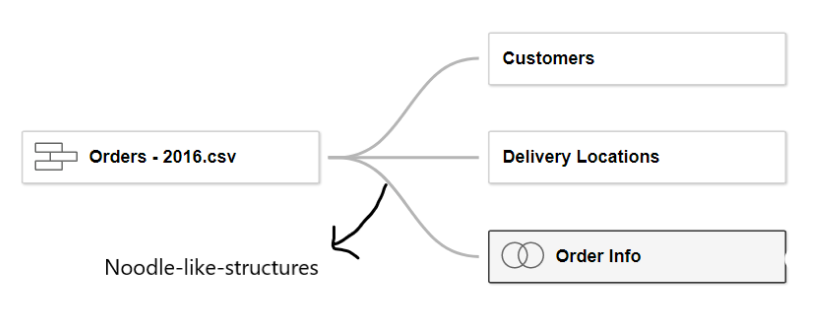
Relationships are the just launched USP of Tableau. It makes data joining easy for all, and doesn’t specifically requires the knowledge of joins/union. These are denoted by a Noodle-like structure and are readily available on the Data Canvas page.
The relationship can only be made in the Logical Layer. These are like a contract between two tables based on some matching field, following that contact Tableau automatically performs appropriate joins and combines the data.
The matching field must have the same data type and it doesn’t matter if matching columns are from the same data source or different. Relationships don’t support Geographical data types as matching fields.
Relationships require at least 1 data source.
Relationships retain the original table structure.
Relationships can’t be defined on published data sources.
Relationships are computed locally.
A Relationship can’t be edited after publishing a data source.
When we join multiple tables using Relationships, Tableau automatically detects the field with the same name and creates a relationship. If data sources have different field names, Tableau would ask the user to define matching columns. A relationship can only be made in a Logical Layer. These are like a contract between two tables based on some matching field, following that contact Tableau automatically performs appropriate joins and combines the data.
The matching field must have the same data type and it doesn’t matter if matching columns are from the same data source or different. Relationships don’t support Geographical data types as matching fields.
Relationships require at least 1 data source.
Relationships retain the original table structure.
Relationships can’t be defined on published data sources.
Relationships are computed locally.
A Relationship can’t be edited after publishing a data source.
When we join multiple tables using Relationships, Tableau automatically detects the field with the same name and creates a relationship. If data sources have different field names, Tableau would ask the user to define matching columns.
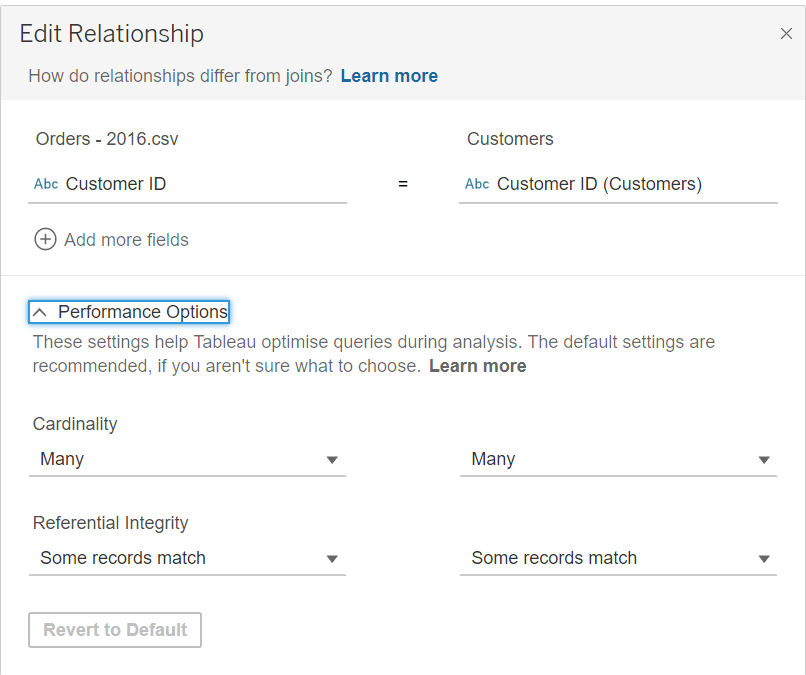
To improve performance, we can modify the cardinality and look into referential integrity. But, most of the time, it is better to leave it to Tableau.
Joins

Joins are a traditional method to combine our data based on certain conditions. In Tableau, Joins can only be done in the physical layer. To create a join, double-click on a logical table.
Joins will always create a new table.
A Join combines the data and then aggregates.
Joins are Static.
It requires at least 1 data source.
It can be applied to multiple data connections.
Joining data with different aggregations or levels of detail can cause data duplication.
Tableau supports four types of joins: Inner, Outer, Left, Right.
For illustrations, let’s take two tables: Names and Marks.
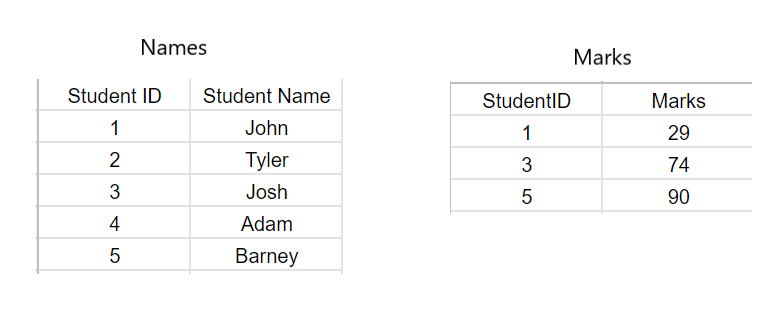
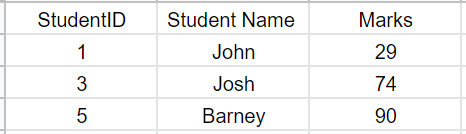
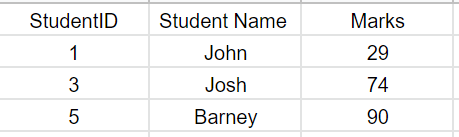
Inner Join → It represents only those values that are common in both tables. If a value isn’t entirely matched in either table, it will be dropped immediately.
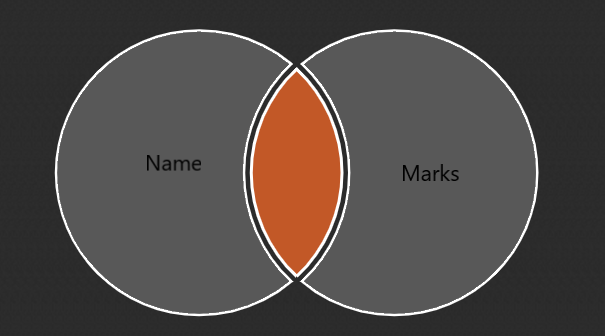
In our examples, we just had marked for StudentID 1,3, 5 and therefore, we got Student Name for those IDs respectively.
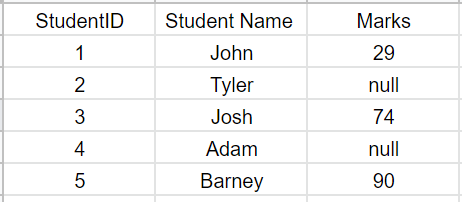
Outer Join → It represents all the values from both the tables, if a value from either table doesn’t match, there will be a null value right there.
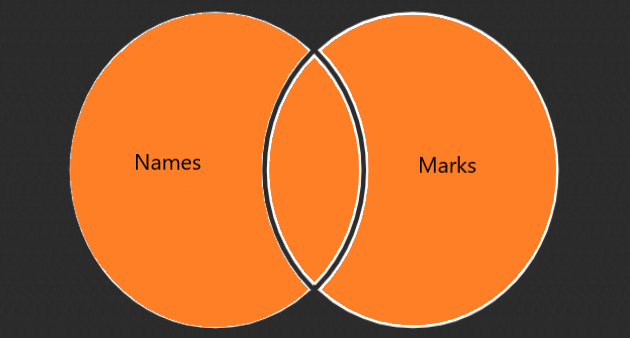
In our example, since we only had 3 matching rows in both tables, the marks for the other ones were assigned as null.
Right Join → It represents all the values from the right table, if a value from left-right table doesn’t match, it will be assigned null.
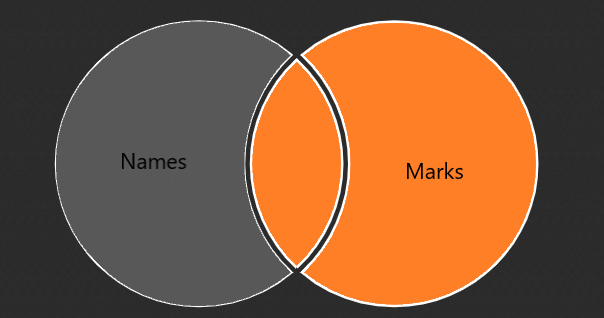
If we perform right join on our tables Name & Marks, the result would be somewhat like inner join(it is not necessary that every time result of inner join and right join will be the same).
But, if we perform the right join between Marks & Name, the result would be totally different i.e. like Outer Join.
Left Join → It represents all the values from the left table, if a value from right table doesn’t match, it will be assigned null.
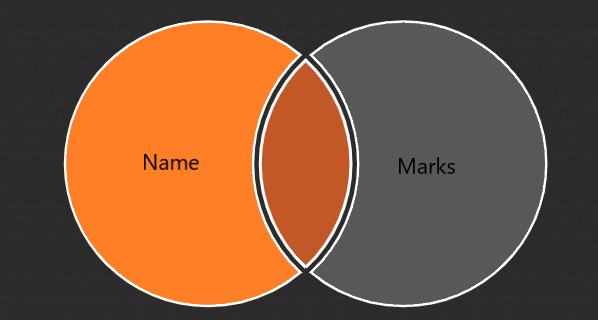
If we perform left join on our tables Name & Marks, the result would be somewhat like outer join(it is not necessary that every time result of outer join and left join will be the same).
But, if we perform left join between Marks & Name, the result would be totally different i.e. like Inner Join.
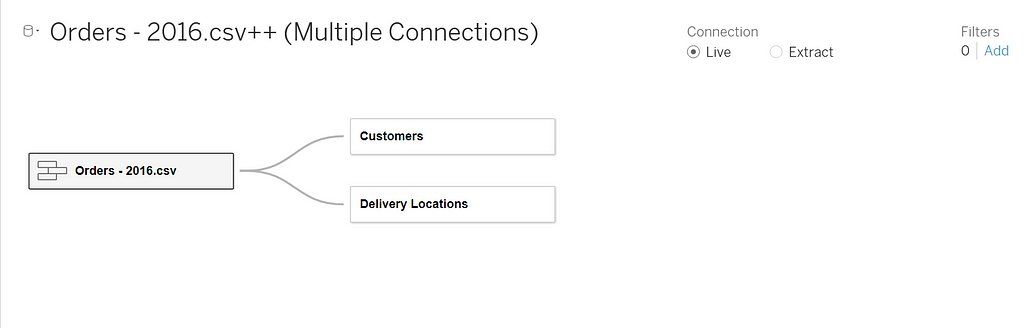
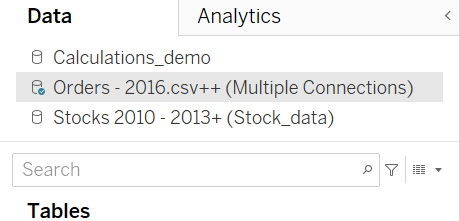
Cross-Database Joins
Cross-database joins requires setting up data sources from multiple connections
To create a Cross-Database join:
Step1: Click on “Add”.
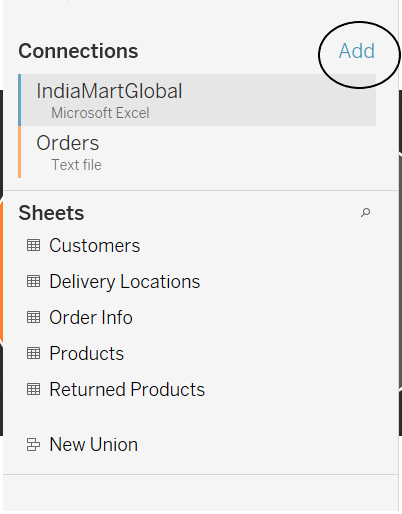
Step2: Add another connection.
Step3: Once we go to the worksheet, we can find all the data in a single source. We can toggle between them.
Union

Union is a way to append two data connections with the same number of columns and data types. This happens in the Physical layer, which can be accessed by double-clicking on a Logical Table.
Union will always create a new table.
Data from different data sources can’t be unioned.
In a union, Tableau adds reference fields to help identify the source of the data.
A unioned table can be used to create joins.
The union can be done in two ways: Manually, Wildcard Search
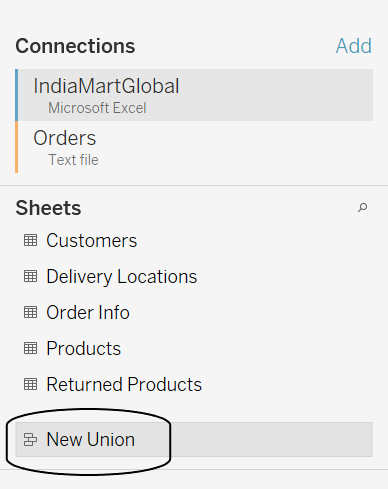
Manual Union
To create a manual union, enter the physical layer and click on “New Union”.
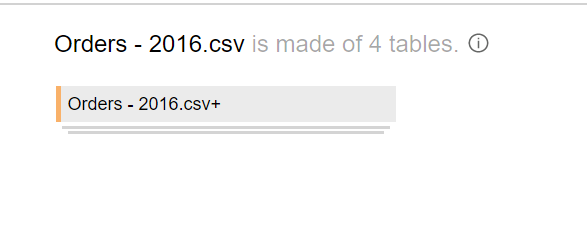
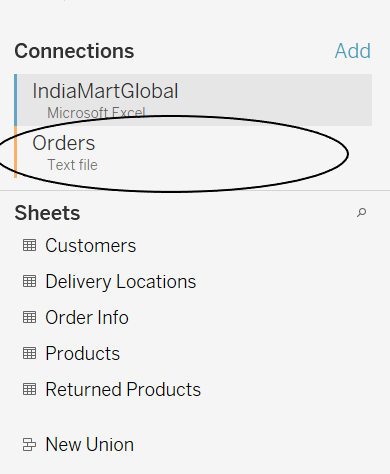
Wildcard Union
This method is automatically creates a union between tables. The wildcard character will help to find a specific pattern for the table name.

It will create a union with all files having “Order” in its name.
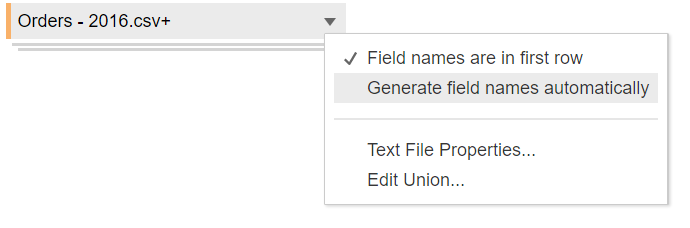
Matching Field Names or Field Ordering
If two fields have different names or no names, we can ask Tableau to perform a union on basis of the ordering of data in tables.
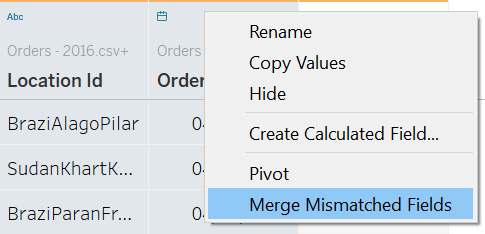
Merging mismatched values
When values in two tables are not matched, they are replaced by null values in the union table. We can merge all the non-matching fields together, to get rid of null values.
Data Blending

Data Blending is another method to join data from multiple connections in Tableau. This is best for connecting data with different levels of details or in simple words, connecting data with different file formats.
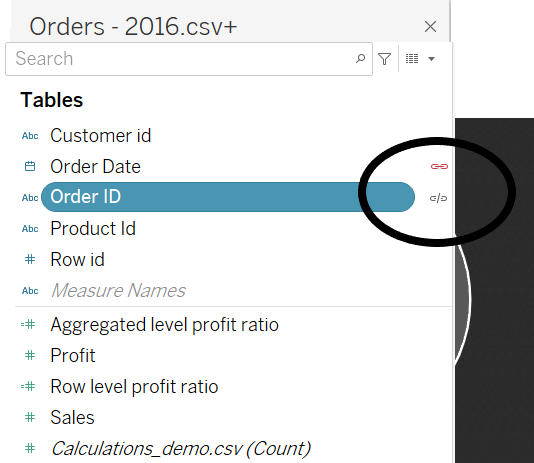
Blending requires two connections namely primary and secondary. The first chosen connection will be deemed as primary and later would be secondary. The primary connection will be represented by blue color, while the secondary connection will be represented by orange color.
A blend aggregates and then combines.
Blends retain the original table structure.
Data Blend is a left-outer join between primary and secondary tables, there might exist some missing data from the secondary table.
Data blends are worksheet specific i.e. different for different worksheets.
There must be a common dimension between the data sources to create a data blend.
Data is never truly combined in Blend but each data source is queried independently and the results are aggregated and presented together.
The blended data can’t be published to Tableau Online or Tableau Server.
There are some data blending limitations around non-additive aggregates, such as COUNTD, MEDIAN, and RAWSQLAGG.
Which one to choose?
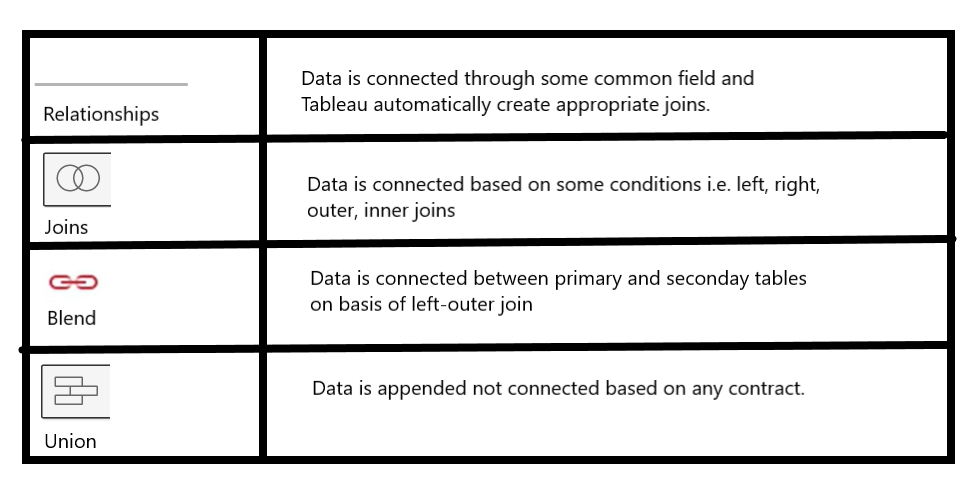
Before answering this question, let's have a recap of all joining types:
Relationships & Joins requires a single data source whereas Blends requires at least two data sources.
Relationship, Join, Blend is the way to bind data on certain conditions but Union just appends the data. Now, the competition and confusion come down to three contenders: Relationship, Joins & Blend.
Summing up:
“Use RELATIONSHIPS if you can, JOIN if you must, BLEND if you absolutely must.” ~ Donabel Santos
Sample Exam Questions from this Topic
Relationships can be joined in Geographical fields/Calculated fields?
- True
- False
Solution: False
____ and ____ retains original table structure.
- Joins
- Relationship
- Blends
- Union
Solution: Blend and Relationship
____ and ____ will always create a new table.
- Join
- Union
- Relationship
- Blend
Solution: Join and Union
Use of which joining method leads to the addition of a reference field?
- Join
- Union
- Blend
- Relationship
Solution: Union
All secondary data in the blend must be aggregated?
- True
- False
Solution: True
Use the link to get access to free Tableau certification dumps (Valid till 13 Apr 2022):
References:
[1] Tableau Help | Tableau Software
[2] Personal Notes
[3]Tableau Desktop Specialist Exam (New Pattern — 2021) — Apisero
[4] sqlbelle
Thanks for Reading!
Feel free to give claps so I know how helpful this post was for you, and share it on your social networks, this would be very helpful for me.
If you like this article and want to learn more about Machine Learning, Data Science, Python, BI. Please consider subscribing to my newsletter:
Find me on the Web: www.dakshtrehan.com
Connect with me at LinkedIn: www.linkedin.com/in/dakshtrehan
Read my Tech blogs: www.dakshtrehan.medium.com
Connect with me at Instagram: www.instagram.com/_daksh_trehan_
Want to learn more?
How is YouTube using AI to recommend videos?
Detecting COVID-19 Using Deep Learning
The Inescapable AI Algorithm: TikTok
GPT-3 Explained to a 5-year old.
Tinder+AI: A perfect Matchmaking?
An insider’s guide to Cartoonization using Machine Learning
How Google made “Hum to Search?”
One-line Magical code to perform EDA!
Give me 5-minutes, I’ll give you a DeepFake!
Cheers
Joining Data in Tableau: A Road to Tableau Desktop Specialist Certification was originally published in Towards AI on Medium, where people are continuing the conversation by highlighting and responding to this story.
Join thousands of data leaders on the AI newsletter. It’s free, we don’t spam, and we never share your email address. Keep up to date with the latest work in AI. From research to projects and ideas. If you are building an AI startup, an AI-related product, or a service, we invite you to consider becoming a sponsor.
Published via Towards AI
Towards AI Academy
We Build Enterprise-Grade AI. We'll Teach You to Master It Too.
15 engineers. 100,000+ students. Towards AI Academy teaches what actually survives production.
Start free — no commitment:
→ 6-Day Agentic AI Engineering Email Guide — one practical lesson per day
→ Agents Architecture Cheatsheet — 3 years of architecture decisions in 6 pages
Our courses:
→ AI Engineering Certification — 90+ lessons from project selection to deployed product. The most comprehensive practical LLM course out there.
→ Agent Engineering Course — Hands on with production agent architectures, memory, routing, and eval frameworks — built from real enterprise engagements.
→ AI for Work — Understand, evaluate, and apply AI for complex work tasks.
Note: Article content contains the views of the contributing authors and not Towards AI.
Related posts
Recent Posts


")

