Investigating the Risks Associated With COVID-19 Using Topic Modeling
Last Updated on July 20, 2023 by Editorial Team
Author(s): Piyush Rumao
Originally published on Towards AI.

“The better we can track the virus, the better we can fight it.”
Objective
Since the outbreak of the novel coronavirus (COVID-19), it has become a significant and urgent threat to global health. Within months of the outbreak, thousands of research papers relating to its effects, risks and treatments have been published. The pace at which research is carried out is increasing at a fast rate. But it brings with it a new problem for someone wanting to look for answers. This generates an opportunity for us, data scientists, to showcase our expertise by developing data mining tools that can help the medical community find answers to highly important scientific questions.
Approach
There are several different lenses through which we could look at different factors associated with COVID-19. I have decided to focus on the risk factors by following an unsupervised approach. Topic modeling is a statistical modeling technique for identifying abstract “topics” that occur in a collection of documents.LDA and LSA are two prominent types of topic modeling techniques of which I will be using LDA. Using which, I will find the most relevant topics and documents of interest to us. Finally, I will show by inter-active visualization what I hope is the optimum topic model.
- COVID-19 data loading and preparation
Recent Kaggle’s call for action initiative to the world’s artificial intelligence experts, Allen Institute For AI has made available over 60,000 scholarly articles, along with their metadata in a JSON format they are being periodically updated.
Kindly refer to the kernel on data loading here which processes, cleans, removes duplicates, and then loads the textual data from JSON into pandas. A snippet of the entire corpus is loaded below.

However, there are many null values under [‘text’, ‘title’, ’abstract’]

The more data we have, the better topics coverage we are going to get, so I decided to combine all textual data into one column as shown below.

Now we will be using “merged_text” column which consists of text data per paper_id
2. Training unsupervised LDA model
Latent Dirichlet allocation(LDA) is a generative statistical model that has proved to be highly effective in topic modeling analysis as it views every document as a mixture of topics.
Now based on the famous paper, “Online Learning for Latent Dirichlet Allocation” by Matthew D. Hoffman, David M. Blei, and Francis Bach. LDA has been implemented both in Gensim and Scikit-learn.
Gensim based LDA has considerably more built-in functionality such as Topic Coherence Pipeline or Dynamic Topic Modeling, which would make it an ideal choice, given that the coherence score could be used to precisely detect a number of topics for the given corpus. However, on the downside, it is extremely slow compared to sklearn’s Cython based implementation for LDA. With a large amount of data to work on and at least a 4 times faster convergence rate, it is an ideal resource to choose for final training. That is provided we know the precise topic number to choose, so I would be initially training gensim based LDA to detect precise topics and then using that topic number run sklearn based implementation for the rest of our analysis.
2.1 Running Latent Dirichlet Allocation with gensim
I will first start with gensim based LDA, by processing input data then training LDA to view topics and finally making use of a coherence score to decide the best value for a number of topics.
2.1.1 Let us prepare input data for our model
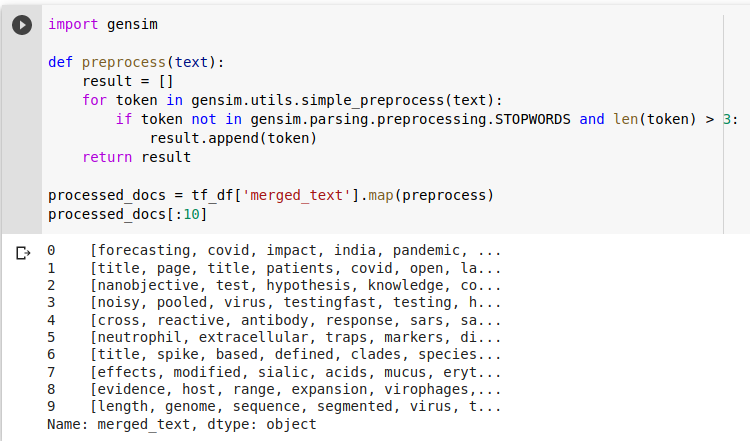
Let us prepare input data for our topic modeling. The first step would be data cleaning that includes creating tokens, removing stopwords, removing words below 3 characters, and then appending those tokens in a list per document. We could make things more interesting by stemming/lemmatizing tokens to root form and generating n-grams.

2.1.2 Generating dictionary and feature data
Machine learning models cannot directly understand text data as we humans do, so this text data needs to be passed through a special translator to convert it into a format that machines can understand. This process is called vectorization or feature extraction. I would be using tf-idf as a feature generator that maps how important a word is to a document in a collection of documents unlike the Bag of words approach which gives importance only to frequent words.

As we see above, I created a dictionary using a processed list that was created earlier, then I filtered out tokens that:
i. occur in less than 100 documents out of 60k documents
ii. occur in more than 70% in the corpus
iii. Keep the top 50k tokens
Then create tf-idf model and apply vector transform on the entire corpus, both dictionary, and tf-idf model could be saved (pickle.dump) for future usage.
2.1.3 Training on parallel Latent Dirichlet Allocation
Gensim provides gensim.models.ldamulticore class which utilizes maximum cores to parallelize and speed up model training compared to gensim.models.ldamodel.LdaModel which is a
single-core based implementation.

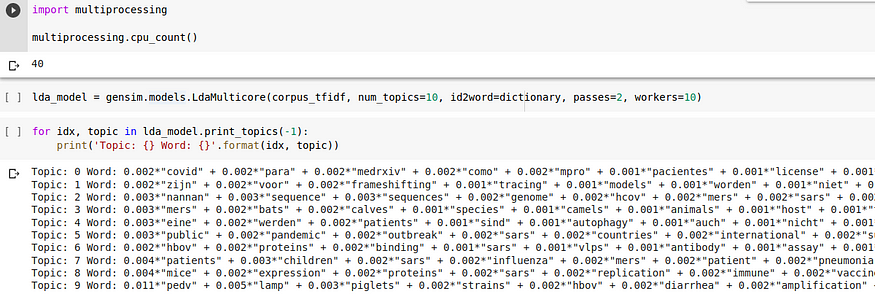
I have set number of workers = 10 and pass = 2 for faster training, let us check the types of topics created when the number of topics = 10
2.1.4 Compute model perplexity and coherence
Perplexity and Coherence scores are evaluation metrics used to decide how well our learned model. Perplexity and Coherence are inversely proportional, lower perplexity score, and higher coherence score the better model.
Let us quickly look at each one of them to know what they represent, perplexity measures the probability of unseen data been assigned to a topic that was learned earlier. However, perplexity works on log-likelihood which doesn’t generalize that well which leads to the development of topic coherence measures. Topic coherence measures semantic similarity between high scoring words in the topic. These calculation helps to distinguish between topics that are semantically interpretable.
Let us calculate and see how well our model scores.

2.1.5 Finding the optimal number of topics for the LDA model
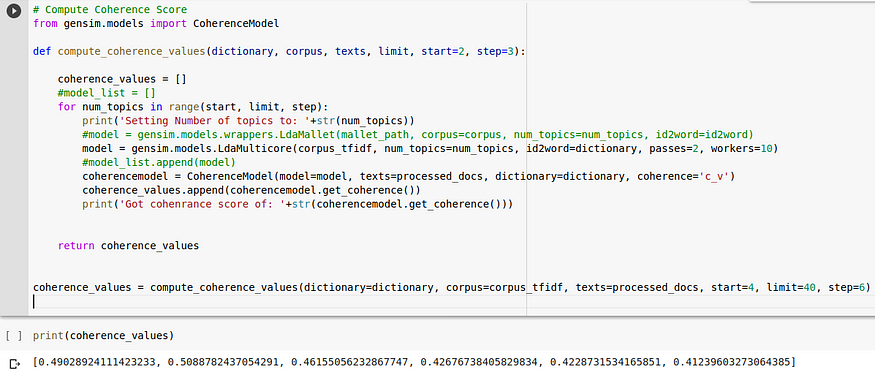
Using the same coherence metrics above we will choose a range of topic values between 4 to 40 and observe the model performance to different topic values.

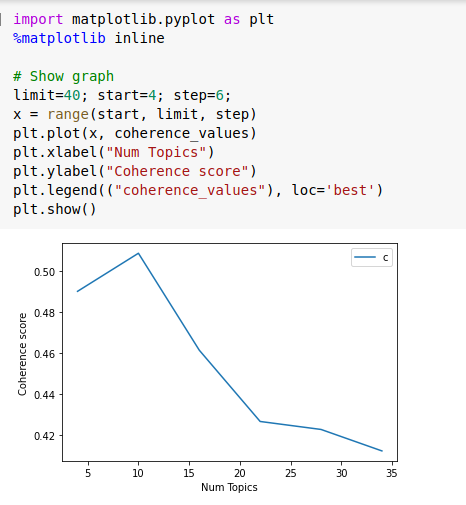
Using code above we can calculate coherence values and plot them as shown below.

As we see above coherence score rises between topic numbers 4–10 and then keeps dropping with no sign of improvement from topic size 15 to 40, so it would be wise to use a topic number between 4 to 12 which displays highest coherence score, so I decided to go with topic number 10.
2.2. Sklearn based Latent Dirichlet Allocation
Unlike gensim, sklearn based LDA is much easier and quicker to use.
2.2.1 Prepare input data for LDA using tf-idf vectorization

Our tf-idf vectorizer ignores stopwords along with words that occur in more than 90% documents in the corpus, then creates uni-grams and bi-grams and selects the top 30k words from the corpus for feature generation.

2.2.2 Training Latent Dirichlet Allocation
I choose number_of_topics = 10 based on gensim’s coherence based optimizer then train it on tf-idf vectors generated from the entire corpus.

2.2.3 Topics created using LDA
Let us view the top 10 words covered under each topic to get a gist of the type of documents covered under those topics.


3. Finding topics most relevant to risk’s related to COVID-19
All sections from here are going to be most critical for our entire analysis. After all, the efforts we went through to get models trained would be of no value if we don’t derive a business value from it and this plays a key factor to the success of any data science project.
I would start by creating a dictionary of unseen documents related to the risk factors of coronavirus.


Using our trained tf-idf vectorizer we will transform text to vectors and then run the LDA model to find which topics are highly related to each risk factor.

All 7 documents on contracting risk and 5 documents on community transmission get the highest ranking of topic 5, while severe illness related risks were found to be covered in topic 2 and topic 5. So a medical researcher looking for answers related to COVID-19 contraction should only look at documents covered under topic 5, while someone looking for illness related to coronavirus should get the majority of his answers in documents covered by topic 2.
4. Finding the most relevant documents using cosine distance metrics
Now, let us consider a case, where someone has found a great article of his/her interest and wants to know if there are more articles that are most similar to it. For that, we will first calculate the topic distribution of documents in the corpus(which all sums up to 1 per article) and then use cosine distance metrics in this topic space distribution to find top K, closest articles.


Now I need to create a list(tasks) with text data for which we want to search nearest neighbors, then convert text to feature vectors using trained tf-idf vectorizer and pass that feature set along with the value of K (number of nearest neighbors to look for) to function get_k_nearest_docs() which computes cosine similarity of input document with entire corpus and returns top K similar documents along with distances.

As we see above, the output for our input document is top 6(value of K given by the user) most similar research papers found in the entire corpus containing research articles on COVID-19.
5. Interactive topics visualization
Visualizations make it much easier to detect patterns, trends, and outliers, so finally I am going to add 2 different visualizations to our detected topics.
For topic modeling, pyLDAvis is a great tool that extracts topics from a fitted LDA model and generates an interactive dashboard for interpretation.
Additionally, I will be building a dashboard using the t-SNE facility which is used for visualizing high dimensional data with the help of bookeh plot.
5.1 pyLDAvis visualization
If you click on Run Pen above, it would load a visualization with 10 unique topics that we have identified displayed in circular bubbles towards the left. The amount of research articles covered by each topic is been represented by the size of the bubble. The unique words which represent a particular topic are been shown towards the right. It would be interesting to know the visualization shown under topic 5 and topic 2, which uniquely identified risks associated with COVID-19.
5.2 Visualization of research papers title occurring in topics using t-SNE
As pyLDAvis library handles the visualization for us above and only displays unique words per topic we get very little freedom in terms of topics displayed, I thought of trying one more visualization for our trained topic model. I transformed the topics which were represented in a higher-dimensional space into 2-dimensional space, then mapped individual research paper id and title to each transformed vector and finally visualized them using a bokeh plot into a shape of the human brain, where unique color cerebrum represented each type of topic learned by our model. Kindly refer to the code below along with a video showing the working of visualization.


6. Conclusion
Let me quickly summarize the entire workflow:
- I started with an initial aim of carrying out topic modeling on the COVID-19 dataset to find out interesting articles about risks associated with it.
- I first loaded the data and processed it for further analysis.
- Then using that data I trained two different implementations of LDA, one using gensim and second using sklearn.
- Using the coherence evaluation metric and number of topics ranging between 4 to 40, I discover an optimal number of unique topics covered by COVID-19 corpus.
- Later I carried out risk-related analysis by creating a dictionary of documents related to risk factors and evaluating which topics did our trained LDA model classify them into.
- Once those topics were identified, documents occurring under those topics were my primary focus of research. I even went a step ahead and used cosine similarity metric to find k nearest neighbors i.e K most similar documents from the same topic as to given input document.
- Finally, I visualized the findings using the pyLDAvis resource facility and also building my own visualization with the help of t-SNE and bokeh.
Hopefully, this process might lead to a more efficient method of distilling useful information from existing data.
There is a huge application of data science in the healthcare industry and every small step that we take today is going to help the transformation from reacting to risk to preventing the risk.
You can find the availability of source code on GitHub. I am looking forward to knowing what you think about it and also am open to your suggestions and feedback if any.
Join thousands of data leaders on the AI newsletter. Join over 80,000 subscribers and keep up to date with the latest developments in AI. From research to projects and ideas. If you are building an AI startup, an AI-related product, or a service, we invite you to consider becoming a sponsor.
Published via Towards AI
Take our 90+ lesson From Beginner to Advanced LLM Developer Certification: From choosing a project to deploying a working product this is the most comprehensive and practical LLM course out there!
Towards AI has published Building LLMs for Production—our 470+ page guide to mastering LLMs with practical projects and expert insights!

Discover Your Dream AI Career at Towards AI Jobs
Towards AI has built a jobs board tailored specifically to Machine Learning and Data Science Jobs and Skills. Our software searches for live AI jobs each hour, labels and categorises them and makes them easily searchable. Explore over 40,000 live jobs today with Towards AI Jobs!
Note: Content contains the views of the contributing authors and not Towards AI.


