


Inventory Management With the Help of Predictive and Prescriptive Analytics Helps Businesses Improve
Last Updated on September 27, 2022 by Editorial Team
Author(s): Saif Ali Kheraj
Originally published on Towards AI the World’s Leading AI and Technology News and Media Company. If you are building an AI-related product or service, we invite you to consider becoming an AI sponsor. At Towards AI, we help scale AI and technology startups. Let us help you unleash your technology to the masses.
Improved Financial Metrics by turning Predictive analytics into Prescriptive analytics
Decisions about inventory management in retail, manufacturing, and supply chain settings are critical to the success of businesses. Improper management of inventories can have a significant impact on a company’s profits by increasing expenses and overhead. While there are many aspects to inventory management, this post will focus on optimizing inventory cost using the operations research method.
Introduction
The holding cost, also known as the inventory carrying cost, is a key metric in determining a company’s overall profitability. This metric is critical because it indicates whether or not your operations are optimized. High holding costs may simply indicate that your company has more inventory on hand than it requires based on demand. This suggests that managers should modify the frequency with which they place orders. In this post, we will also look at a comprehensive example and learn how to solve and optimize decisions. To put it simply, imagine you own a retail store that sells both perishable and nonperishable goods. The cost of storing inventory or storage is incurred to store these items. There is also an opportunity cost since when you order surplus goods, that capital may be invested in something more productive. There are also more costs, such as administrative and material handling costs. Thus, it is critical that managers make sound purchasing decisions in order to meet demand while avoiding excess inventory.
It is believed that the inventory carrying cost or holding cost is $1 per unit per day. As stated, holding cost comprises all costs associated with holding goods, such as storage, servicing, inventory risk, and other opportunity costs.
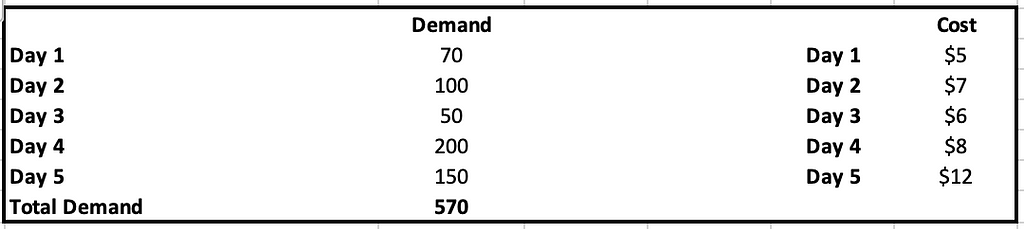
Table 1 shows the demand for the next few days. This is where demand forecasting may help. To begin, you’ll need a predictive model to forecast demand for each day, depending on the organization. This is necessary while making purchasing decisions. When the management makes a choice, the following factors may be considered:
1. Whether we purchase and store products today in order to sell them later because of a low price on a particular day/season.
2. The price may rise later.
3. What is the storage capacity per day?
There are several other questions that which the manager has to work on.
According to table 1, on day 1, we can purchase goods at a lower cost than on other days, so the manager must be thinking, why not actually purchase everything on that day? Let us calculate the cost:
The total demand is 570 for all the days.
$5 * 570 + $1 * 100 + $2 * 50 + $3 * 200 + $4 * 150 = $4250
If we purchase 570 items in one day, we will have a lower rate of $5, but we will have a higher inventory holding cost. As you can see, 100 items are for sale the next day, so there will be a $1 holding cost. Similarly, 50 items on day 3 will incur a holding cost of $2 for two days. As a result, a tradeoff exists between production/purchase cost and holding cost. When we focus on purchase cost, we may end up increasing holding cost, and when we focus on holding cost, we may have to sacrifice purchase cost.
Let us consider another scenario in which we buy and sell on the same day without holding any inventory. In this case, there will be no inventory holding costs.
$5 * 70 + $7 * 100 + $6 * 50 + $8 * 200 + $12 * 150= $4,750
In this case, even though there is no holding cost, the total cost is $4750 higher than in the previous one.
As a result, we must find the optimal combination of inventory levels in order to reduce overall costs.
Total cost is determined by two factors:
Purchase Cost: This is determined by the price on that particular day.
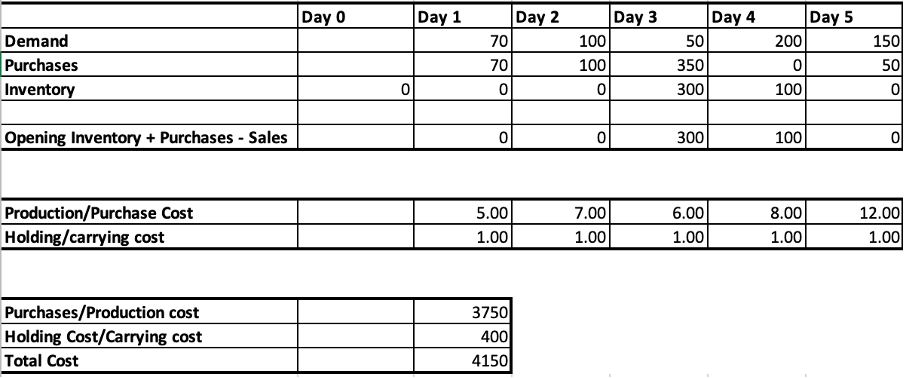
Holding Cost: The holding cost is $1 per day and is determined by the ending inventory. For example, if the ending inventory on day 3 is 300, the holding cost will be 300 * $1=$300. Then, on day four, assuming no further purchases are made, the ending inventory will be 100 because 200 items will be sold that day. As a result, the holding cost will be $100. This equals $100 + $300 = $400. The table above summarizes this.
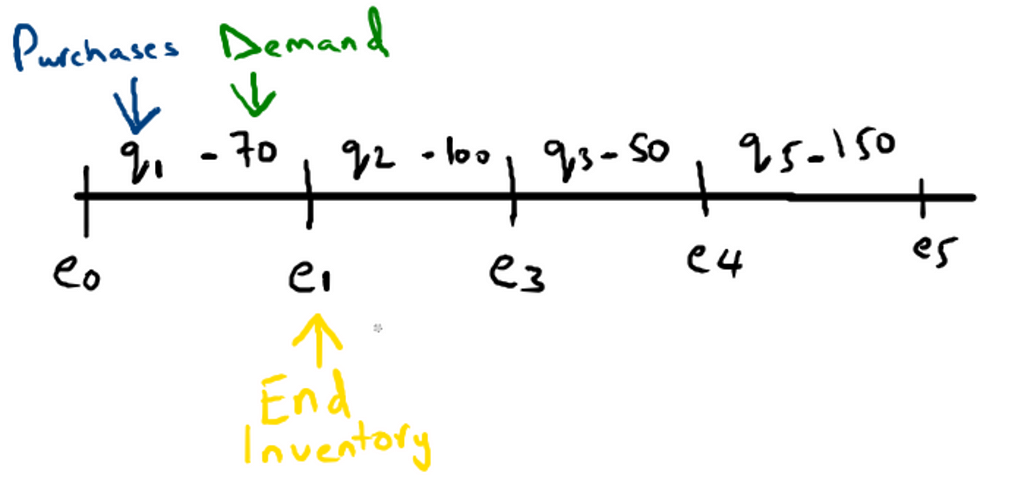
The key point here is to understand the inventory balancing constraint. This is due to the fact that inventory holding costs are calculated based on ending inventory. Also, the ending inventory must equal to opening inventory, adding purchases minus sales. Let us now define how ending inventory is calculated:
Ending inventory = Opening Inventory + Purchases — Sales
The diagram below will help you understand.
Optimization Equations
Now that we understand the concepts let us define objective function and constraint
Decision Variables:
Let q be the items needed to be purchased/produced on each day
Let e be ending inventory each day
So in total, we have 10 decision variables.
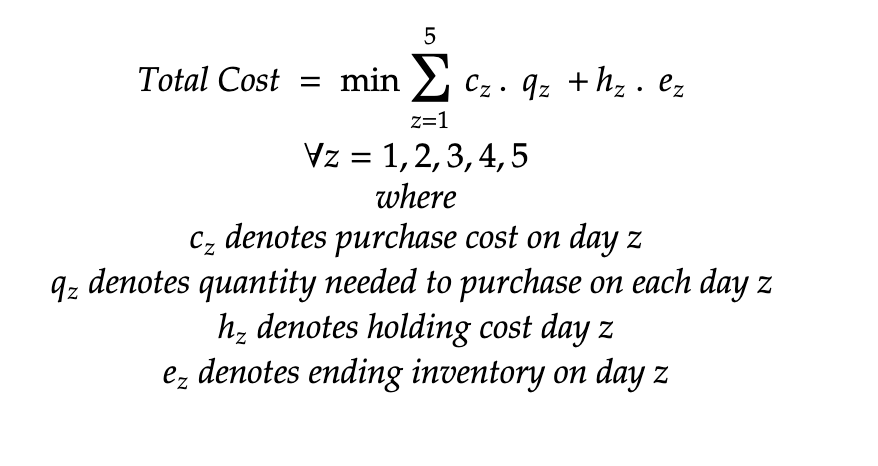
Objective Function:
We need to minimize the total cost.
Total Cost = Purchase Cost + Holding Cost
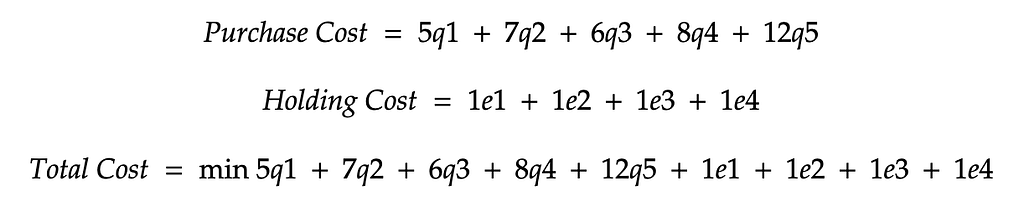
Let us write in more formal mathematical notation:
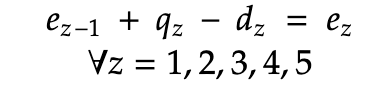
Inventory balancing Constraints:
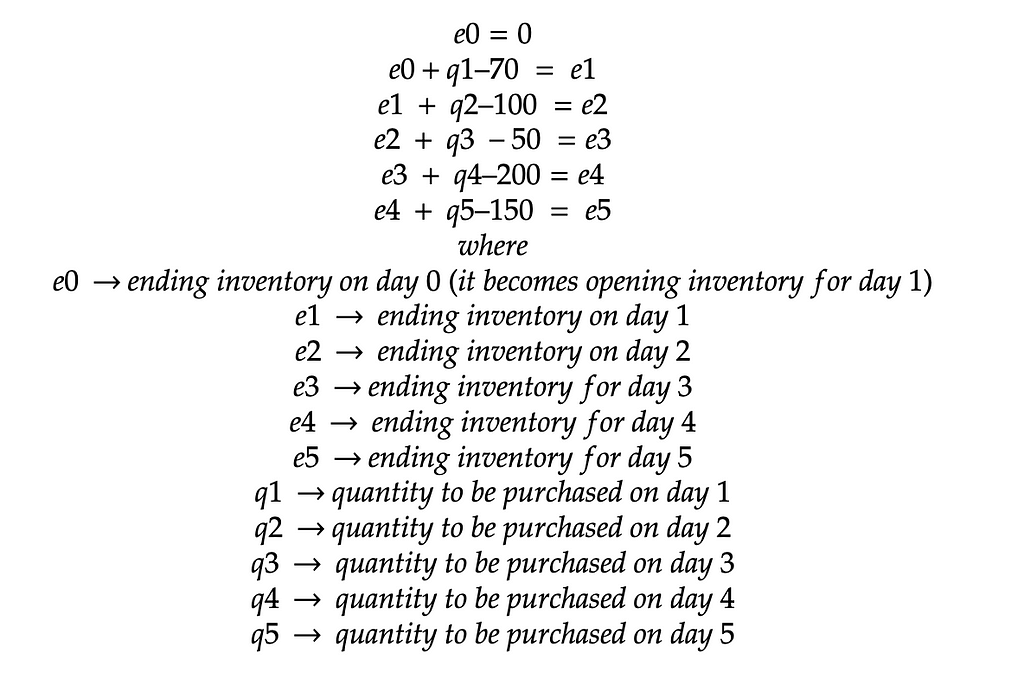
Let us write in a more formal mathematical notation:
Complete Equation
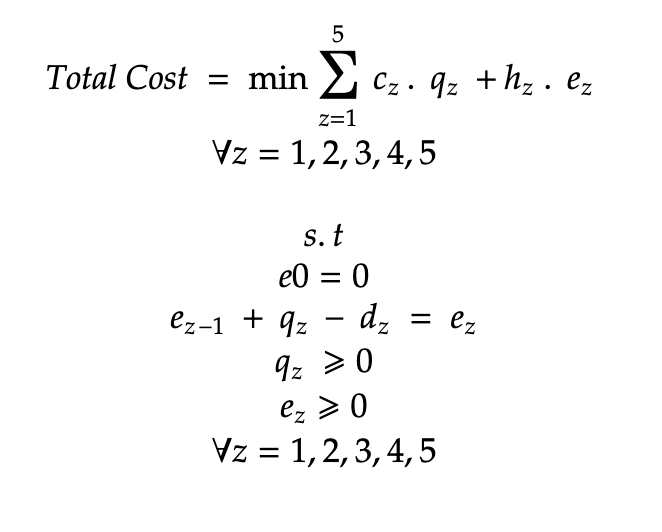
To summarize, we are just trying to minimize total cost subject to inventory balancing constraints. Also, quantity purchased and ending inventory cannot be negative.
Solving using different Tools (Excel and Python)
Let us first solve this using Microsoft excel, and then we will solve it in python.
Using Excel
Step 1: Initialize and Define
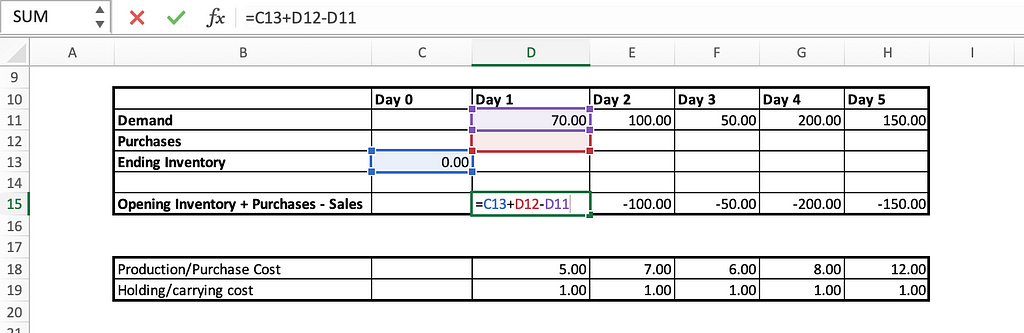
We have defined demand for each day, as you can see here. Purchases are what we expect to find each day; we do not yet know how many purchases we will need to make each day. Ending Inventory will be defined by a constraint, which will be satisfied by the inventory balancing constraint defined on row 15. You can also look at the formula. For example, on day 1, we use the previous day’s ending inventory as opening inventory for day 1 (C13), add purchases (D12), and subtract sales/demand (D11). This is equivalent to what we defined in equation (ii) above.
Step 2: Objective Function
We aim to minimize overall cost, which is made up of two components: holding cost and purchase cost.
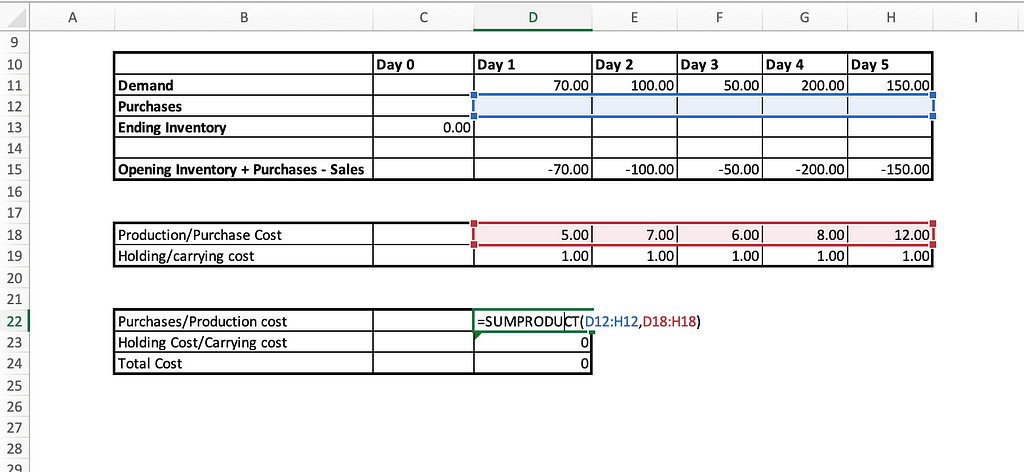
We have defined purchase cost, holding cost, and total cost here. If you notice the purchase cost formula, what we are doing here is simply multiplying purchases on each day by the respective purchase cost on that day. In the same way, we will do it for holding costs. Total cost is simply the sum of the purchase and holding costs. This is equivalent to what we defined in equation (i)
Step 3: Setup Solver
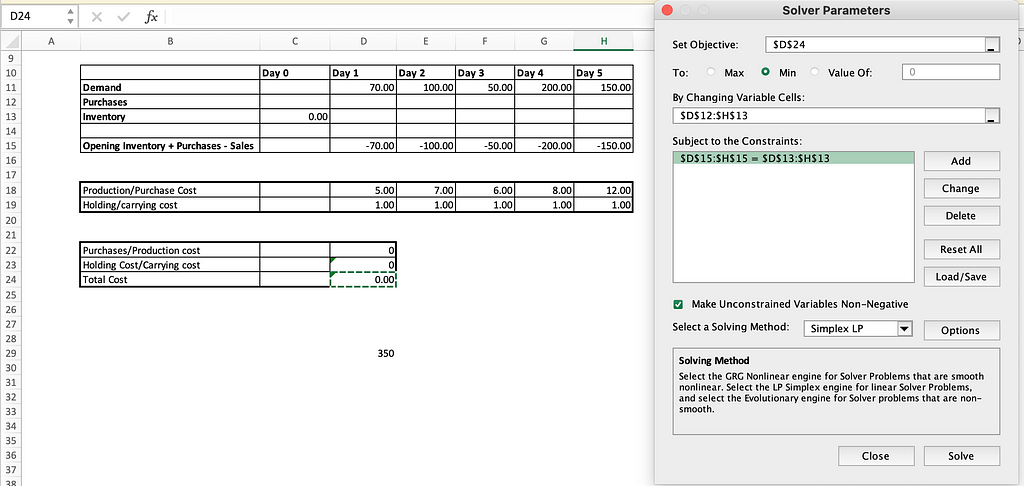
D24(Total Cost) is what we aim to minimize. This is what we provided in “set objective section”.
The decision variable is purchase quantity and ending inventory that we aim to solve based on constraint and objective function. This is what we provided in “By Changing Variable Cells”
The constraint is that ending inventory must equal to opening inventory + purchases — sales. This is what we provided in “Subject to the Constraints Section” that is row 13(ending inventory) must equal to row 15(opening inventory + purchases — sales).
Make sure you mark “Make unconstrained variables non-negative”. This is because we do not want negative inventory values.
You can refer to equation (iii) for understanding.
Step 4: Solve and get values that minimize the total cost
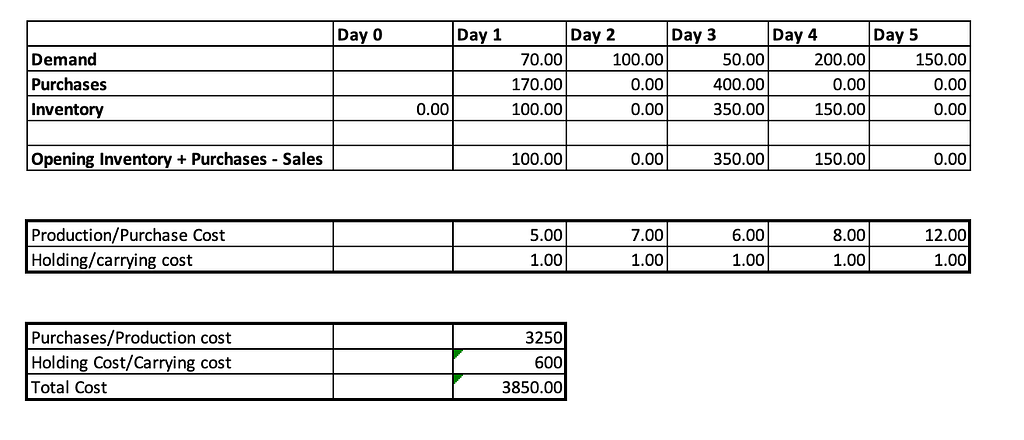
This is how the overall solution appears. That is, on day one, we must purchase 170 quantities, 0 on day two, 400 on day three, 0 on day four, and 0 on day five. This solution minimizes the total cost (purchase cost + holding cost).
Using Python
Now that we’ve gone over everything in detail with a good intuitive understanding, we’ll write some Python code (pyomo package) to do the same thing and see if we get the same results.
import numpy as np
from pyomo.environ import *
model = ConcreteModel()
days=6
# demand
d = [None, 70,100,50,200,150]
# holding cost
h = [None,1,1,1,1,1]
# unit purchase cost
c = [None,5,7,6,8,12]
# quantity needed to purchase
model.q = Var(range(days),domain=NonNegativeReals)
# ending inventory
model.e = Var(range(days),domain=NonNegativeReals)
# model objective function includes both holding cost and purchase cost
model.objective = Objective(expr = sum( (model.q[day] * c[day]) + (model.e[day] * h[day]) for day in range(1,days,1)), sense=minimize)
# add model constraints
model.constraints = ConstraintList()
# ending inventory is 0 on day 0 so would be the opening for day 1
model.constraints.add(model.e[0]==0)
# inventory balancing constraints
for day in range(1,days,1):
    model.constraints.add(model.e[day] == model.e[day-1] + model.q[day] - d[day])
# create a solver
solver = SolverFactory('glpk')
# solve
solver.solve(model)
Comments are already mentioned in the code, which we discussed in great detail. Let us now see if we can achieve the same results or not.
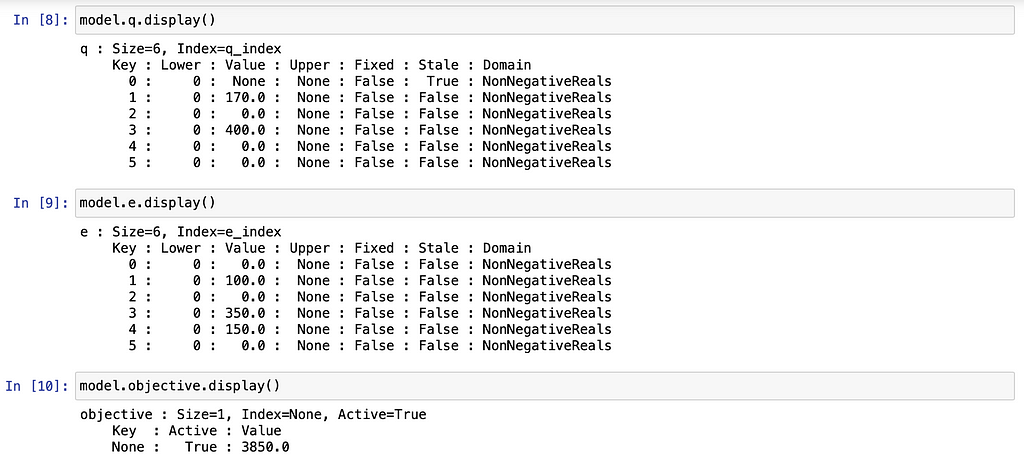
As we can see, the quantity needed to purchase (q) and ending inventory (q) are exactly the same and have the same optimized cost value of 3850.
Conclusion
In this post, we discussed in detail how the use of predictive models in conjunction with operation research could transform predictive analytics into prescriptive analytics, allowing decision-makers to make practical decisions. This issue is critical for businesses because it has a direct impact on the income statement and accounting ratios.
References
[1] https://www.investopedia.com/terms/h/holding-costs.asp
[2] https://www.accountingtools.com/articles/holding-costs
[3] https://www.tradegecko.com/inventory-management/introduction-to-carrying-costs
[4] http://www.columbia.edu/itc/sipa/U6033/client_edit/lectures/lec4.pdf
Inventory Management With the Help of Predictive and Prescriptive Analytics Helps Businesses Improve was originally published in Towards AI on Medium, where people are continuing the conversation by highlighting and responding to this story.
Join thousands of data leaders on the AI newsletter. It’s free, we don’t spam, and we never share your email address. Keep up to date with the latest work in AI. From research to projects and ideas. If you are building an AI startup, an AI-related product, or a service, we invite you to consider becoming a sponsor.
Published via Towards AI
Towards AI Academy
We Build Enterprise-Grade AI. We'll Teach You to Master It Too.
15 engineers. 100,000+ students. Towards AI Academy teaches what actually survives production.
Start free — no commitment:
→ 6-Day Agentic AI Engineering Email Guide — one practical lesson per day
→ Agents Architecture Cheatsheet — 3 years of architecture decisions in 6 pages
Our courses:
→ AI Engineering Certification — 90+ lessons from project selection to deployed product. The most comprehensive practical LLM course out there.
→ Agent Engineering Course — Hands on with production agent architectures, memory, routing, and eval frameworks — built from real enterprise engagements.
→ AI for Work — Understand, evaluate, and apply AI for complex work tasks.
Note: Article content contains the views of the contributing authors and not Towards AI.
Related posts
Recent Posts
")


")


