


How Exploratory Data Analysis Helped Me Solve Million-Dollar Business Problems
Last Updated on January 27, 2023 by Editorial Team
Last Updated on January 27, 2023 by Editorial Team
Author(s): Puneet Jindal
Originally published on Towards AI.
EDA is a powerful method to get insights from the data that can solve many unsolvable problems in business. In the increasingly competitive world, understanding the data and taking quicker actions based on that help create differentiation for the organization to stay ahead!
Before moving ahead, let me share the official definition mentioned on the internet
Exploratory Data Analysis (EDA) is a process of analyzing data sets in order to summarize their main characteristics [1][2], often using statistical or graphical techniques. It is used to discover trends [2], patterns, relationships, and anomalies in data, and can help inform the development of more complex models [3]. It can also be used to generate hypotheses and test them, identify important variables, detect outliers, and assess relationships among variables. EDA is an iterative process, and is used to uncover hidden insights and uncover relationships within the data.
Let me walk you through the definition of EDA in the form of a story. This story is very personal to me due to the fact that this moment added to my conviction to enter the data science field and explore it further to create a social impact in the world.
Disclaimer:- i would not name the organization to which this story belongs to avoid any sort of revealing any confidential information.
When I interview many newbies, their story is usually about entering Data Science because it is termed the sexiest job of the 21st century. But I didn’t about data science in a way on how it is known. My case was purely accidental and driven by curiosity.
I started my journey as a software engineer around technologies such as web stack including python, javascript, and java stack. I got very passionate about building products where I could see the impact in front of me. To that end, I started picking up more responsibilities such as managing databases both SQL and NoSQL.
One day, I finished my assigned work, and I heard a senior business colleague of mine complaining about data accessibility to my dept head. He mentioned that his team was trying to download business reports. The majority of the downloads were failing, or downloads were very slow and this was impacting his team’s efficiency and leading to job dissatisfaction every day.
Because of this, they asked my tech dept. head to add more high-end servers, and high-speed internet, and purchase high-memory laptops for his team to look at the reporting data as they were struggling to even the downloaded files in case it gets downloaded. This meant a huge IT investment ask.
I volunteered to look at the issue and did the following steps.
First, I got access to the data reporting system so that I could download the data from the server logging database. The data was in the form of JSON, and so it had to be converted into some easy-to-understand format such as CSV or any other tabular format.
So I planned to use pandas, and it was in a few MBs, so I could do the analysis on my laptop with 16GB RAM.
Then, I loaded these server logs JSON into Jupyter Notebook and installed various libraries such as Pandas and Matplotlib. With Pandas, I loaded JSON files into a data frame so that I could perform data transformations such as extracting hours of the day for all the records, etc.
You can learn about such transformation operations at https://towardsdatascience.com/how-to-convert-json-into-a-pandas-dataframe-100b2ae1e0d8
Pandas helped me reformat data in a easy to analyze format and matplotlib helped me plot the charts on the data
If you want to dive deep into Pandas and Matplotlib on a sample dataset as a beginner, you can follow the video below.
What I did next found patterns and basis that I plotted charts such as downloads happening by user or server CPU utilization by hours of the day etc. What I got was something mind-boggling.
3 simple insights but actionable ones!
- All of the users across the company were downloading all the data in the morning between say 10 am -11 am, and the rest of the day, servers were completely idle.
- Further, when I had a discussion with the team, they had to remove the irrelevant data after downloading all of the data, and as the database was getting bigger, the download size was getting larger. This meant that they were unnecessarily downloading 10x more data, almost all of the database, including historical data, which they didn't even need for most of the day-to-day decision-making.
- There were users who didn’t need the data but were still requesting the data and exchanging that data over emails as well.
Actions taken to above insights gained
- Peak server capacity was only needed for a few minutes in the day when the user needed data access, so we built a scalable solution to adjust server size dynamically for optimum utilization, which is a version of today’s serverless computing systems. So the server would only be billed for the time users requested for the reports according to the size of the query.
- A UI interface was built to provide relevant filters such that only required data could be downloaded by the users, such as team-wise access to limited reports. Later we went to automate this to complete Business Intelligence and Reporting tool having aggregated and detailed charts.
- data governance — Different roles were assigned to users based on their needs such that they could only access the data they should have access to.
Benefits from the above insights
- Optimum utilization of server capacity helped reduce server costs equivalent to 2 hours instead of 24 hours.
- Improved efficiency of the team member because of the speed of downloading while providing relevant data without purchasing new high-end laptops helping with unavoidable IT infra expenditure
- Enable data compliance and security
By now, whatever I explained is nothing but an Exploratory data analysis process. Loved the following depiction of a workflow
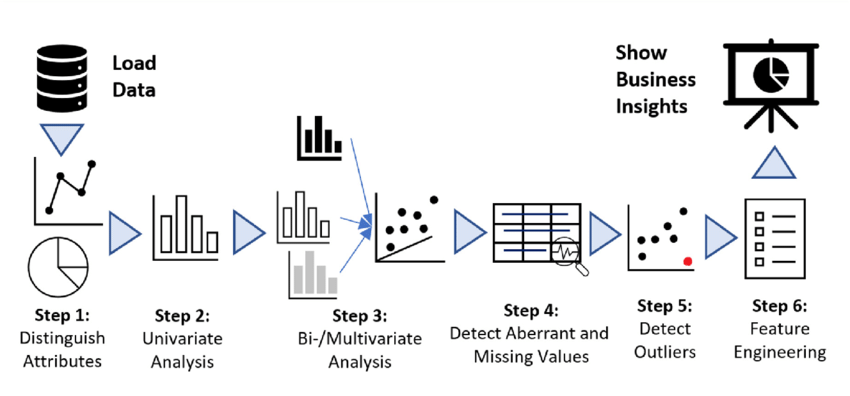
I hope you understand how looking into data without even an assumption or hypothesis in hand could reveal simple but actionable insights or even new objectives. These insights create a positive impact on the organization by opening revenue-generation opportunities or cost reductions.
Now the above story that I shared is only for structured data such as with rows and columns.
Now that i mentioned about structured data, you should be aware that there are 2 types of data — structured and unstructured data. For more detailed understanding you can read this great article here
As I progressed through my career, I got lucky with a host of opportunities to do advanced analytics in logistics, e-commerce, retail, healthcare, mortgage, CRM, etc. Across all of the projects that I did on these jobs, EDA was always the first step to creating value out of data.
According to IDC, 80% of the world’s data will be unstructured by 2025.
Source:https://deep-talk.medium.com/80-of-the-worlds-data-is-unstructured-7278e2ba6b73
Unstructured is primarily in the form of images, videos, and documents. There are so many courses and tools out there for doing EDA on structured data, but not many on unstructured data, such as NLP and computer vision-related analytics.
EDA is the basic step towards any basic analytics or advanced analytics projects such as predictive modeling, Artificial Intelligence, and machine learning-related downstream analytics, which helps in solving use cases such as self-driving, medical imaging, autonomous agriculture robots, vision-based predictive maintenance, satellite imagery-based insurance, and so on.
So in a way we as a community just eased the structured data EDA which just represents less than 10–15% of the total data collected by an organization or over the internet.
Imagine how awesome it would be if we analyzed all the data and used that for predictive models or analytics. Those models will be a better representative of deeper business insights.
A question could occur that it might be too expensive to spend time on EDA when there is no objective in hand and, at times, could be anti-efficiency.
The amount of time spent on an EDA depends on the complexity of the data set and the specific objectives of the analysis. Generally, experts recommend spending at least 10 to 20 percent of the total project time on EDA.
This includes activities such as exploring the data, identifying patterns, and assessing the quality of the data. Additionally, Exploratory Data Analysis should be revisited throughout the project to ensure the insights obtained from the data remain valid and relevant. But it's worth the time in my experience as it gives the way to create many new innovations and even products.
My final question to you!
Do you feel the same about the importance of Exploratory Data Analysis, especially for structured and unstructured data combined?
If yes, let’s connect over Linkedin as I write interesting and new aspects in the computer vision data preparation field, and I am happy to chat on the same. Only technical deep dive!
How Exploratory Data Analysis Helped Me Solve Million-Dollar Business Problems was originally published in Towards AI on Medium, where people are continuing the conversation by highlighting and responding to this story.
Join thousands of data leaders on the AI newsletter. Join over 80,000 subscribers and keep up to date with the latest developments in AI. From research to projects and ideas. If you are building an AI startup, an AI-related product, or a service, we invite you to consider becoming a sponsor.
Published via Towards AI
Towards AI Academy
We Build Enterprise-Grade AI. We'll Teach You to Master It Too.
15 engineers. 100,000+ students. Towards AI Academy teaches what actually survives production.
Start free — no commitment:
→ 6-Day Agentic AI Engineering Email Guide — one practical lesson per day
→ Agents Architecture Cheatsheet — 3 years of architecture decisions in 6 pages
Our courses:
→ AI Engineering Certification — 90+ lessons from project selection to deployed product. The most comprehensive practical LLM course out there.
→ Agent Engineering Course — Hands on with production agent architectures, memory, routing, and eval frameworks — built from real enterprise engagements.
→ AI for Work — Understand, evaluate, and apply AI for complex work tasks.
Note: Article content contains the views of the contributing authors and not Towards AI.
Related posts
Recent Posts


")

